

How to Use Drawing Tools (Original K-Line)
Website
App
Popular Articles
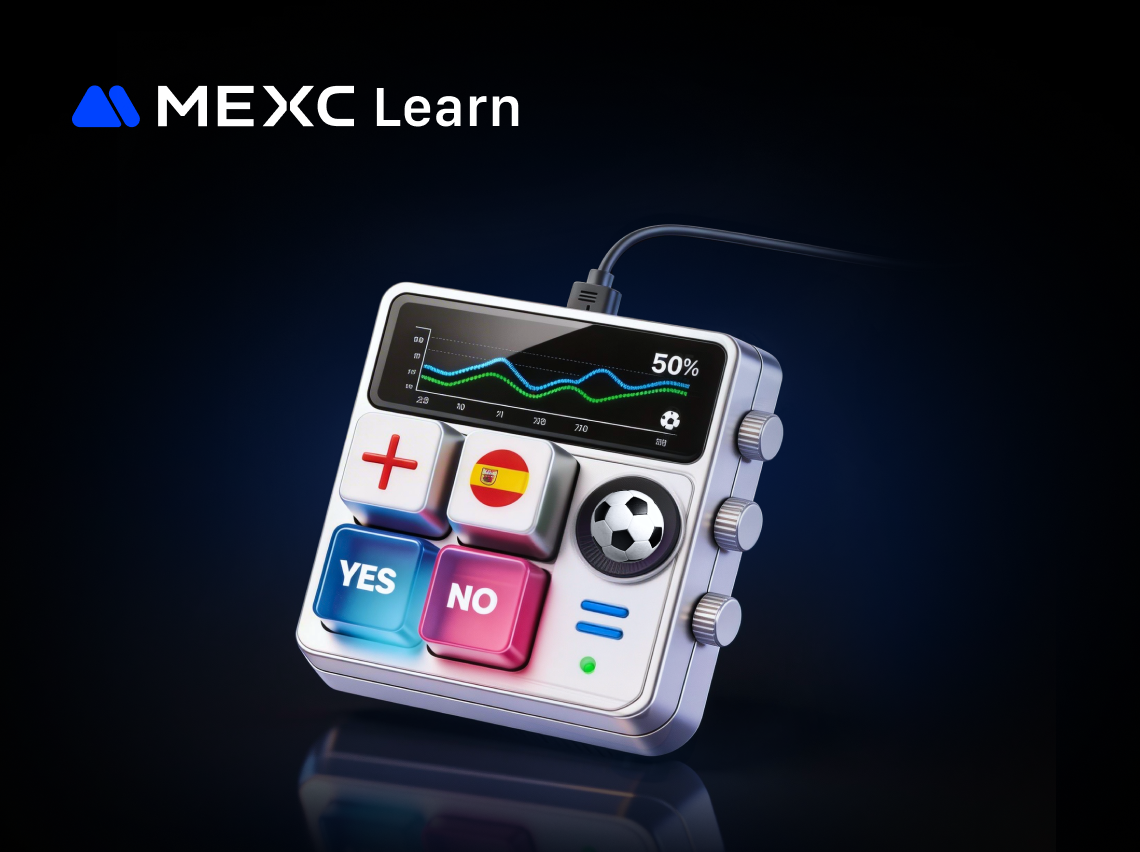
Best Prediction Market Platforms 2026: Crypto vs. Fiat Compared
The best prediction market platforms in 2026 include MEXC, Polymarket, Kalshi, and PredictIt. Crypto-based platforms like MEXC and Polymarket offer competitive fees and fast settlement, while fiat-bas

Are Prediction Markets Accurate? Betting Odds vs. Traditional Polls
Prediction markets have emerged as powerful tools for forecasting real-world events, particularly in politics. By translating collective expectations into prices, these platforms generate what are com

Related Articles

Analysis of Common Technical Indicators in the Cryptocurrency Market
In crypto trading, technical indicator analysis refers to a quantitative method that uses mathematical and statistical formulas to assess market trends. By processing price and volume data through spe

How to Quickly Draw Price Lines and High/Low Price Lines
In cryptocurrency trading, candlestick charts are an essential tool for traders' daily market analysis. Among them, the price line and high-low price lines are fundamental yet critical components of t


