

Dogecoin Price Plunges 6% As Elon Musk Renews DOGE Moon Mission Vow With “It’s Time” Tweet
The Dogecoin price has plunged 6% in the last 24 hours to trade at $0.1633 as of 2:42 a.m. EST on trading volume that skyrocketed 115% to $3.5 billion.
This comes as Elon Musk renewed his DOGE moon mission vow after tweeting “It’s time” on X, recalling his 2021 promise to send “a literal Dogecoin to the literal moon” through SpaceX’s DOGE-1 mission.
Musk’s fascination with Dogecoin has continued over the years, with his tweets repeatedly moving its price.
He has continuously called DOGE the people’s crypto, supporting the idea that DOGE could become the currency of Mars.
Crypto ETFs Move Forward Despite Regulatory Silence
In another development, Bitwise and Grayscale announced management fees for their upcoming XRP and Dogecoin ETFs (exchange-traded funds), even though they have not yet received official approval from the US Securities and Exchange Commission (SEC).
The move to list their ETFs without waiting for SEC approval mirrors Grayscale’s recent move with its Solana ETF, which launched despite the lack of a formal SEC sign-off.
Grayscale plans a 0.35% fee for both its XRP and Dogecoin ETFs, according to recent filings.
Interestingly, the recent government shutdown and updated regulatory processes have opened an unexpected window for crypto firms to list ETFs without facing the usual SEC procedural delays.
If the ETFs launch successfully, it could mark a new era for digital asset investment in the US, giving crypto firms more room to innovate despite ongoing regulatory uncertainty.
Dogecoin Price Under Sustained Bearish Pressure
After attempting to reclaim the $0.30 range earlier this year, the DOGE price has entered a sustained downtrend, as it breaks down below key Fibonacci support levels.
The recent Dogecoin price action shows the token consolidating below significant resistance barriers, signaling sustained bearish momentum in the broader market.
The decline began after DOGE failed to maintain support above $0.20, triggering a deeper correction that pushed the price below both the 50-day and 200-day Simple Moving Averages (SMAs).
Currently, the 50-day SMA sits around $0.2205, while the 200-day SMA is positioned at $0.2095. The position of the SMAs confirms that sellers remain in control.
DOGE is trading near $0.1633, hovering close to the key Fibonacci retracement level of 0.786 ($0.1714). A sustained close below this level increases the likelihood of a move toward the critical support zone between $0.14 and $0.15, where buyers previously managed to absorb heavy selling pressure.
Meanwhile, the Relative Strength Index (RSI) on the daily chart stands around 31, signaling that DOGE is nearing oversold territory, as it continues to experience consistent bearish pressure.
The Fibonacci retracement structure further highlights that the next potential resistance levels lie near $0.17, followed by $0.205 and $0.22, all of which align with previous breakdown zones and the overhead SMAs.
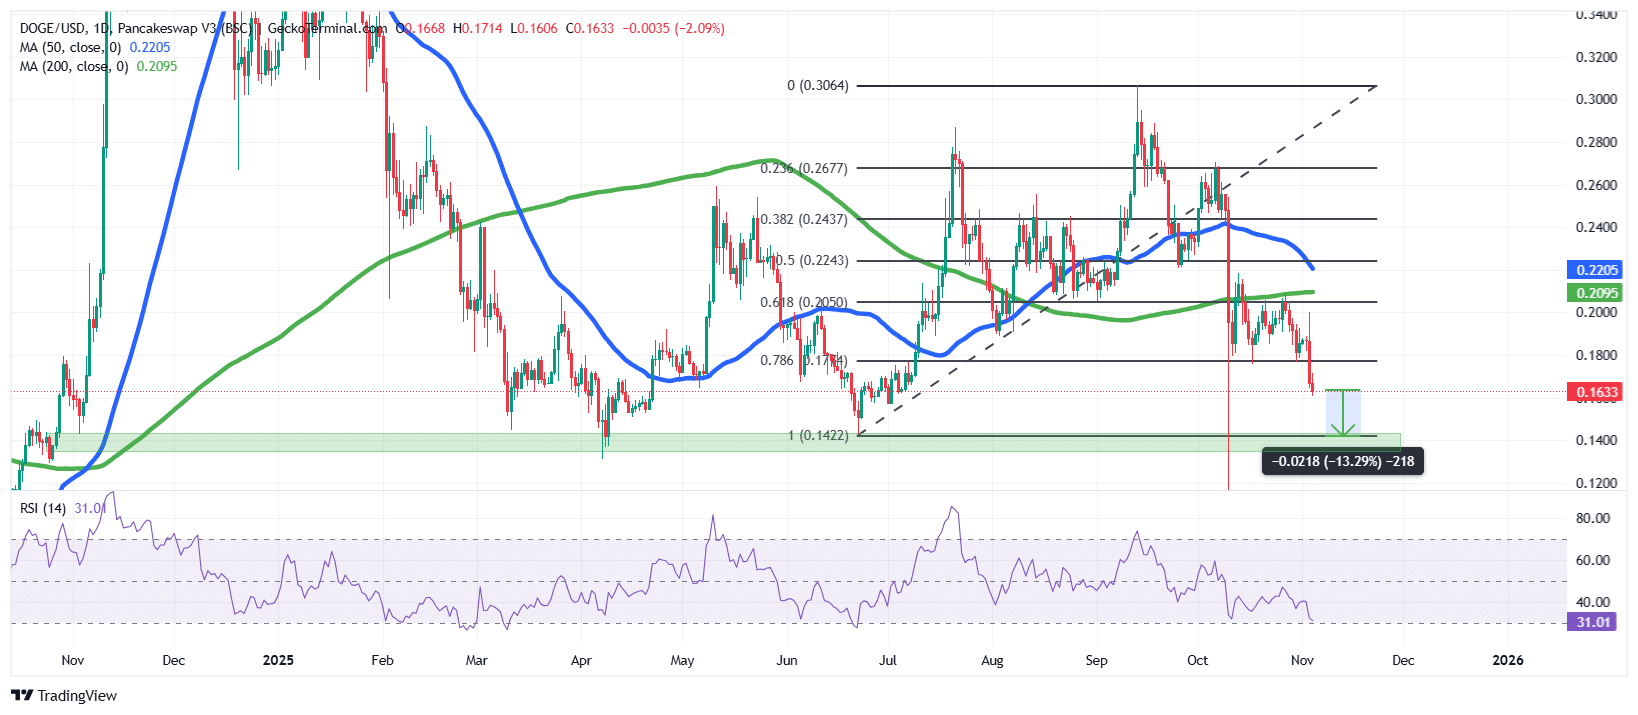 DOGE/USD Chart Analysis Source: GeckoTerminal
DOGE Price Faces Further Downside Risk
Based on the current DOGE/USD technical outlook, the DOGE price remains under intense bearish pressure in the short term.
With the RSI dropping within the 30-oversold level, sellers continue to show their strength. Meanwhile, the 50-day SMA is closing in on the 200-day SMA, and if it crosses below, they would form a death cross, which could be a hint of an incoming bearish trend.
If the bearish momentum persists, Dogecoin could retest the $0.14 support, implying a potential 13% decline from current levels.
This comes as Ali Martinez, a popular crypto analyst with over 161K followers on X, noted that whales sold over 1 billion DOGE tokens in the last week.
Conversely, a rebound above $0.17 could trigger a short-term recovery toward $0.20 (0.618 Fib level).
Related News:
You May Also Like

Russia’s Central Bank Prepares Crackdown on Crypto in New 2026–2028 Strategy

Japanese Yen rises on safe-haven demand and intervention concerns
