Chainlink price nears breakout as Bollinger Bands tighten after Bitwise LINK ETF launch
Chainlink price is hovering near the top of its recent range with traders watching for a decisive move following the launch of the Bitwise Chainlink ETF.
- LINK is consolidating as volatility tightens and leverage cools.
- ETF launch improves access despite short-term trading currently cautious.
- Technical setup points to a sharp move once range breaks.
LINK was trading around $13.84 at press time, down 1.5% on the day. Despite the dip, the token is still up 3.7% over the past week and more than 8% over the last month, showing steady upward drift rather than sharp momentum.
Spot trading activity has cooled slightly. Daily volume slipped to about $618 million, down 0.4%. Derivatives data tells a similar story. CoinGlass data shows futures volume down 2.8% to $872 million, while open interest edged lower by 0.4% to $668.8 million.
When both metrics fall together, it usually points to traders reducing leverage and waiting for a clearer direction rather than pressing new bets.
ETF launch and fundamentals add context
The Bitwise Chainlink ETF (CLNK) officially began trading on NYSE Arca on Jan. 14, making it the second U.S. spot ETF offering direct exposure to LINK after Grayscale’s GLNK launch in December.
The fund is physically backed by Chainlink (LINK) held with Coinbase Custody, with BNY Mellon handling cash operations. Bitwise set a 0.34% management fee, waived for the first three months on up to $500 million in assets to encourage early participation.
On its first day, the ETF recorded $2.59 million in net inflows, $3.24 million in trading volume, and a net asset value of $5.18 million. Staking is not supported at this stage.
While the initial inflows were modest, ETF launches often have a delayed impact. They lower the friction for institutions and advisors who cannot access tokens directly, which can slowly improve liquidity and reduce reactive selling during pullbacks.
Beyond the ETF, Chainlink has seen several supportive developments this month. A draft version of the U.S. Digital Asset Market Clarity Act proposes treating LINK as a network token under CFTC oversight, potentially easing long-term regulatory risk.
Additionally, Chainlink recently introduced Confidential Compute at the protocol level, a feature targeted at institutional and enterprise use cases that permits private off-chain execution with on-chain settlement.
Chainlink price technical analysis
From a technical perspective, LINK is clearly in consolidation mode. Price has been holding between roughly $13.00 and $14.20, forming a tight base after the ETF launch.
Candles have smaller bodies and limited wicks, showing neither buyers nor sellers are pushing aggressively. This type of price action often appears before expansion.
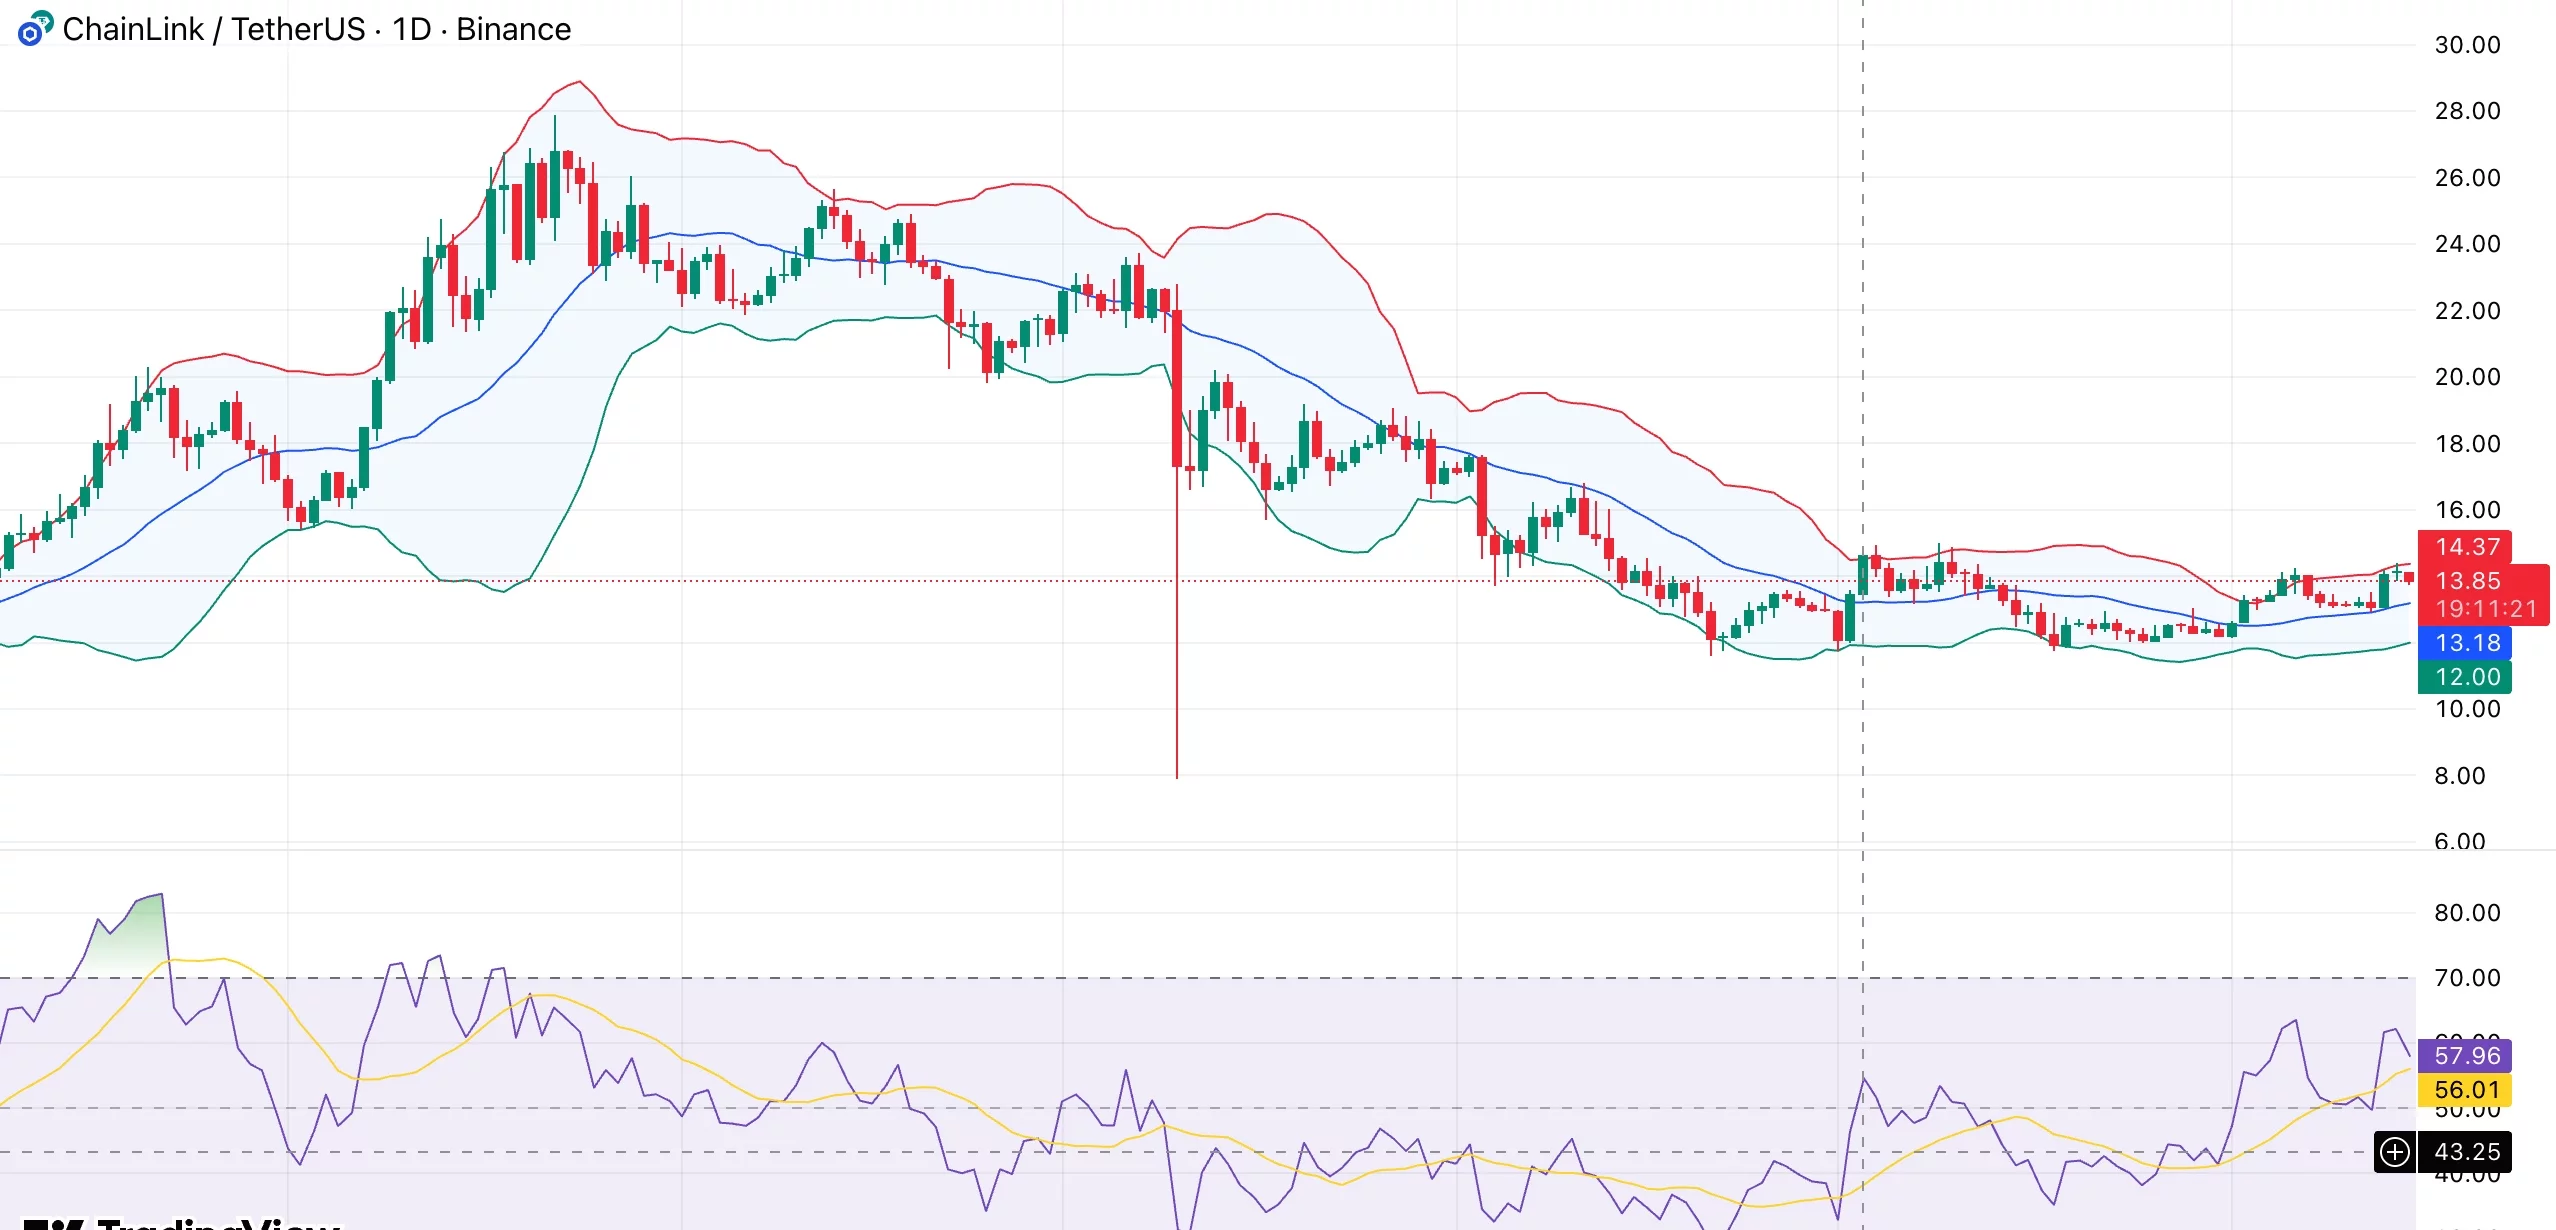
Bollinger Bands are now tightly compressed, confirming a low-volatility regime. Prices often move sharply when they break out of the band.
Momentum indicators lean constructive but not stretched. There is space for follow-through as the relative strength index is close to 58. The average directional index indicates that trend strength is still developing rather than fully established, and the MACD is in positive territory.
Support is clearly defined between $13.00 and $13.20, which corresponds to the 20- and 30-day moving averages. The structure remains intact as long as the price stays above this range on daily closes. A clean break below $13 would likely invite a deeper pullback toward the $12.80 region.
On the upside, resistance sits at $14.00–$14.20. This level has capped price multiple times and lines up with short-term horizontal supply. A daily close above $14.20, especially with rising volume, would open the door toward $15.00, where the 100-day moving average comes into view.


You May Also Like

Stablecoins have evolved into everyday tools in LATAM

Bitcoin Exchange Binance Announces New Listings on its Futures Platform! Here Are the Details