XRP (XRP) price is showing early signs of a potential bottom after forming a swing failure pattern (SFP) around the $1.80 level.XRP (XRP) price is showing early signs of a potential bottom after forming a swing failure pattern (SFP) around the $1.80 level.

XRP price forms a swing failure, signaling a potential bottom

XRP price prints a swing failure pattern at $1.80 and reclaims support, suggesting downside exhaustion as traders watch the $1.98 level for bullish confirmation.

Summary
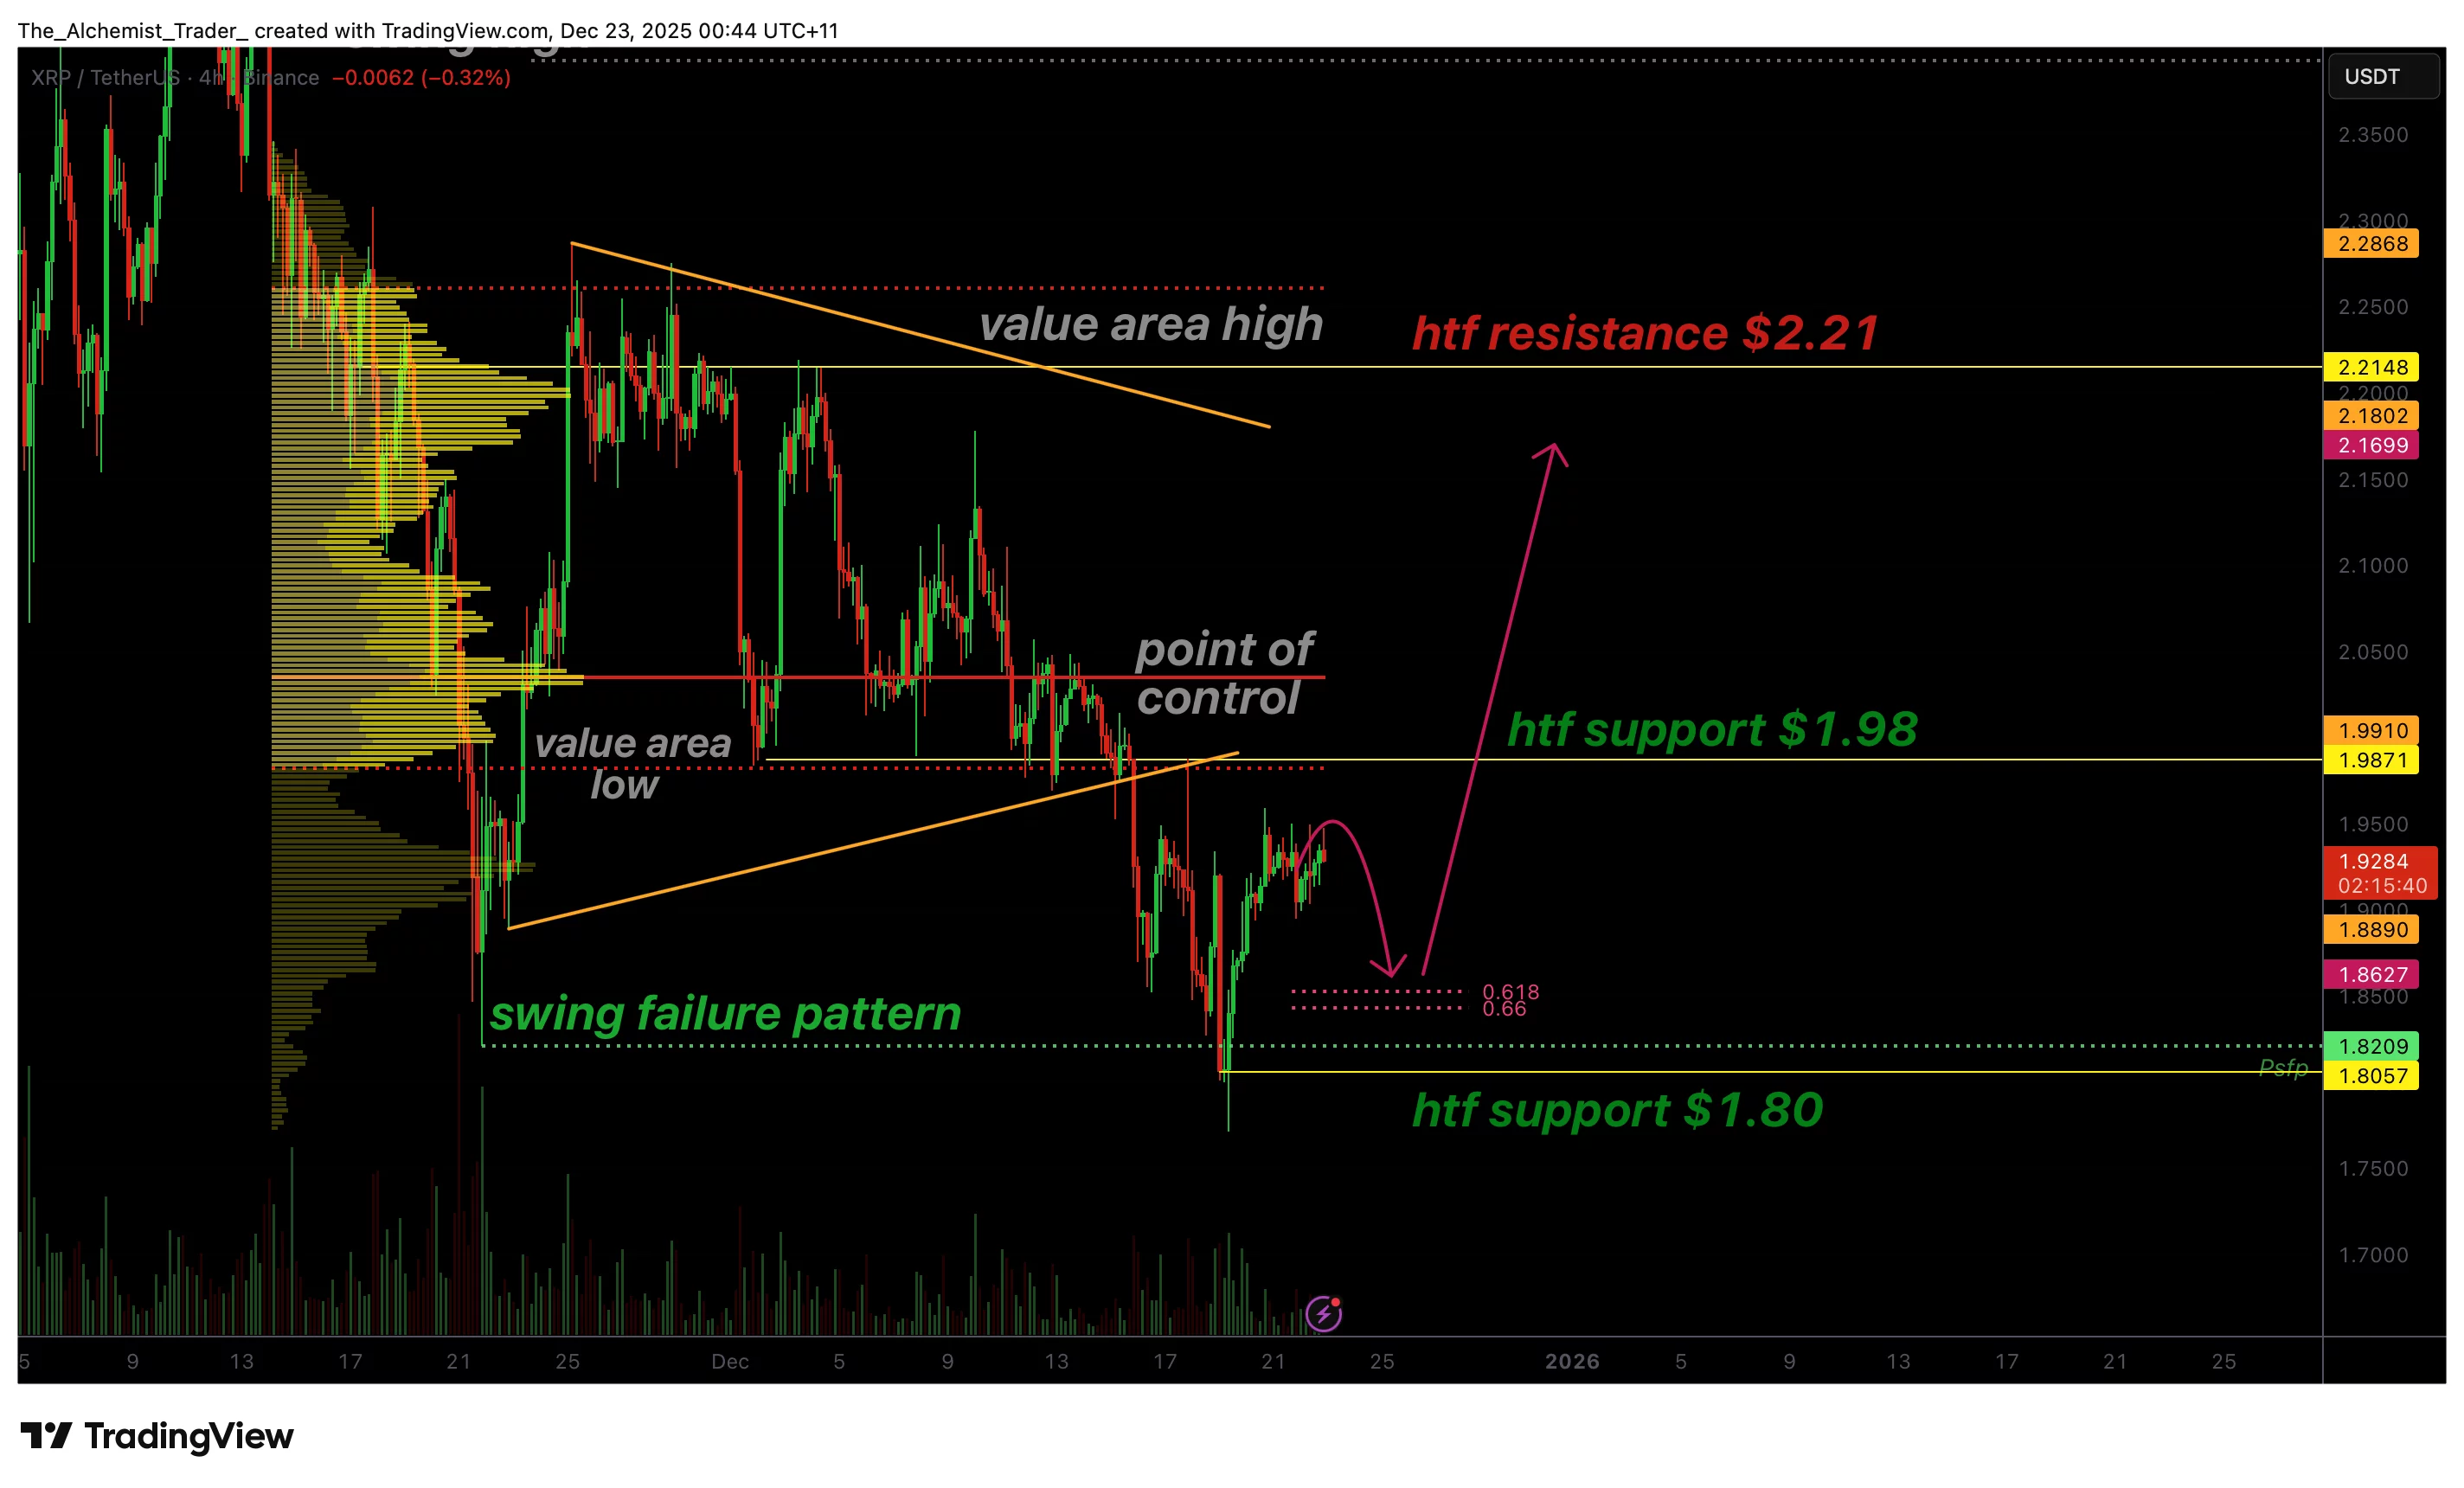
  • The swing failure pattern forms at $1.80, suggesting a local bottom.
  • Price remains below the $1.98 Point of Control resistance.
  • Reclaiming $1.98 could open a move toward $2.20.

XRP (XRP) price is showing early signs of a potential bottom after forming a swing failure pattern (SFP) around the $1.80 level. This pattern, often associated with downside exhaustion, has emerged as the price reclaimed the $1.80 region after briefly trading below it.

While confirmation is still pending, the structure suggests that selling pressure may be weakening, opening the door for a short-term bullish recovery if key resistance levels are reclaimed.

XRP price key technical points

  • Swing failure pattern forms at $1.80, signaling possible downside exhaustion.
  • Price trades below the Point of Control at $1.98, which remains the key resistance to reclaim.
  • Holding the 0.618 Fibonacci retracement could confirm the bullish setup.
XRP price forms a swing failure, signaling a potential bottom - 1

The swing failure pattern at $1.80 is technically significant because it reflects a failed attempt by sellers to sustain price below a key support level. In an SFP, price briefly breaks below support, triggers liquidity, and then quickly reclaims the level, trapping late sellers. This behavior often marks local bottoms, especially when it occurs after an extended decline.

In XRP’s case, the reclaim of $1.80 suggests that buyers are actively defending this region. However, price has since moved lower after rejecting from the Point of Control (POC) near $1.98, a level that represents the highest traded volume within the current range. This rejection indicates that while downside pressure may be easing, bulls have not yet regained control, even as XRP-linked ETF assets climb past $60 million despite ongoing weakness in the token’s spot price.

The current pullback toward the 0.618 Fibonacci retracement is a critical test for the bullish thesis. This level often serves as a key support during corrective phases in the development of reversals. If price holds this region and forms higher lows, it would add further confirmation to the swing failure pattern and strengthen the probability of continuation higher.

From a market-structure perspective, XRP remains in a transitional phase. While the swing failure pattern suggests a potential shift in momentum, the broader structure has not yet flipped decisively bullish. Price is still trading below the POC and below the Value Area Low, which means acceptance back into higher value has not been achieved.

One level to watch remains $1.98. This region serves as both the POC and a high-time-frame resistance. A clean reclaim of $1.98 on a closing basis would signal acceptance of value and confirm the swing failure pattern as a valid bottoming structure. Such a move would likely open the path for a rally toward the $2.20 resistance, where prior selling pressure has previously emerged.

Until that reclaim occurs, caution is warranted. Failed swing failure patterns can lead to renewed downside if buyers fail to follow through. This is why holding above $1.80 and defending the 0.618 Fibonacci level is essential for maintaining bullish momentum.

Volume behavior will also be a key confirmation factor. A successful breakout above $1.98 should be accompanied by increased volume, signaling genuine demand rather than a short-lived relief bounce. Without this, any upside movement risks being corrective rather than impulsive.

In summary, XRP’s price action reflects a market at an inflection point. The swing failure pattern at $1.80 offers a constructive signal, but confirmation remains dependent on how price behaves around key volume and resistance levels.

What to expect in the coming price action

If XRP holds above the 0.618 Fibonacci level and reclaims the $1.98 Point of Control, the probability of a bullish continuation toward $2.20 increases. Failure to reclaim this region would keep price rotational and warrant continued caution.

Market Opportunity
XRP Logo
XRP Price(XRP)
$2.1723
$2.1723$2.1723
+3.51%
USD
XRP (XRP) Live Price Chart
Disclaimer: The articles reposted on this site are sourced from public platforms and are provided for informational purposes only. They do not necessarily reflect the views of MEXC. All rights remain with the original authors. If you believe any content infringes on third-party rights, please contact service@support.mexc.com for removal. MEXC makes no guarantees regarding the accuracy, completeness, or timeliness of the content and is not responsible for any actions taken based on the information provided. The content does not constitute financial, legal, or other professional advice, nor should it be considered a recommendation or endorsement by MEXC.

You May Also Like

NZD/USD holds losses below 0.5750 ahead of China trade data

NZD/USD holds losses below 0.5750 ahead of China trade data

The post NZD/USD holds losses below 0.5750 ahead of China trade data appeared on BitcoinEthereumNews.com. NZD/USD extends its losses for the second successive day
Share
BitcoinEthereumNews2026/01/14 09:54
US SEC approves options tied to Grayscale Digital Large Cap Fund and Cboe Bitcoin US ETF Index

US SEC approves options tied to Grayscale Digital Large Cap Fund and Cboe Bitcoin US ETF Index

PANews reported on September 18th that the U.S. Securities and Exchange Commission (SEC) announced that, in addition to approving universal listing standards for commodity-based trust units , the SEC has also approved the listing and trading of the Grayscale Digital Large Cap Fund, which holds spot digital assets based on the CoinDesk 5 index. The SEC also approved the listing and trading of PM-settled options on the Cboe Bitcoin US ETF Index and the Mini-Cboe Bitcoin US ETF Index, with expiration dates including third Fridays, non-standard expiration dates, and quarterly index expiration dates.
Share
PANews2025/09/18 07:18
SUI Price Eyes Breakout, Targets $11 Says Analyst

SUI Price Eyes Breakout, Targets $11 Says Analyst

The post SUI Price Eyes Breakout, Targets $11 Says Analyst appeared on BitcoinEthereumNews.com. SUI price shows a technical setup for a macro breakout with analyst Dan Gambardello targeting $10-$11 levels. Recent partnership with Google’s Agentic Payments Protocol adds fundamental support to the technical analysis as SUI moves closer to potential breakout levels. SUI Price Analysis Points to $10-$11 Breakout Target Dan Gambardello has identified a clear ascending triangle formation on SUI price daily chart with upside targets around $10.79. The analyst simplified this target range to $10-$11 for practical trading purposes. The pattern shows sustained higher lows meeting resistance at current levels before a potential breakout. VanEck maintains more aggressive SUI crypto targets ranging from $13-$25 according to Gambardello’s research. SUI Price Analysis | Source: Dan Gambardello, X The $10 level is a more conservative higher high area for the current cycle. Midterm targets point to $7.50 in the 1.618 Fibonacci extension zone before longer-term objectives. The monthly RSI shows extreme compression that Gambardello describes as “screaming for a macro breakout to the upside.” This momentum oscillator behavior typically precedes major price movements in the crypto market. SUI crypto risk model currently sits at 51 and matches pre-bull market levels seen in coins like Ethereum. Gambardello compared this to Ethereum’s December 2020 reading of 51 before its major breakout. The March 2017 Ethereum reading of 53 preceded that cycle’s parabolic move. The analyst also noted that SUI price trades near the same levels from almost a year ago in November 2024. Bollinger Bands Signal Historic Compression CryptoBullet has identified the tightest Bollinger Bands in SUI’s entire trading history on the weekly chart. The BBW indicator compression reached levels that were historically followed by major price movements. This setup mirrors conditions before SUI’s previous major rallies. Historical data shows SUI price delivered +253% gains between December 2023 and March 2024 following similar compression. SUI…
Share
BitcoinEthereumNews2025/09/18 11:32