The Defected Story Points Model in Extreme Programming

Abstract and 1. Introduction

  1. Background and 2.1. Related Work

    2.2. The Impact of XP Practices on Software Productivity and Quality

    2.3. Bayesian Network Modelling

  2. Model Design

    3.1. Model Overview

    3.2. Team Velocity Model

    3.3. Defected Story Points Model

  3. Model Validation

    4.1. Experiments Setup

    4.2. Results and Discussion

  4. Conclusions and References

3.3. Defected Story Points Model

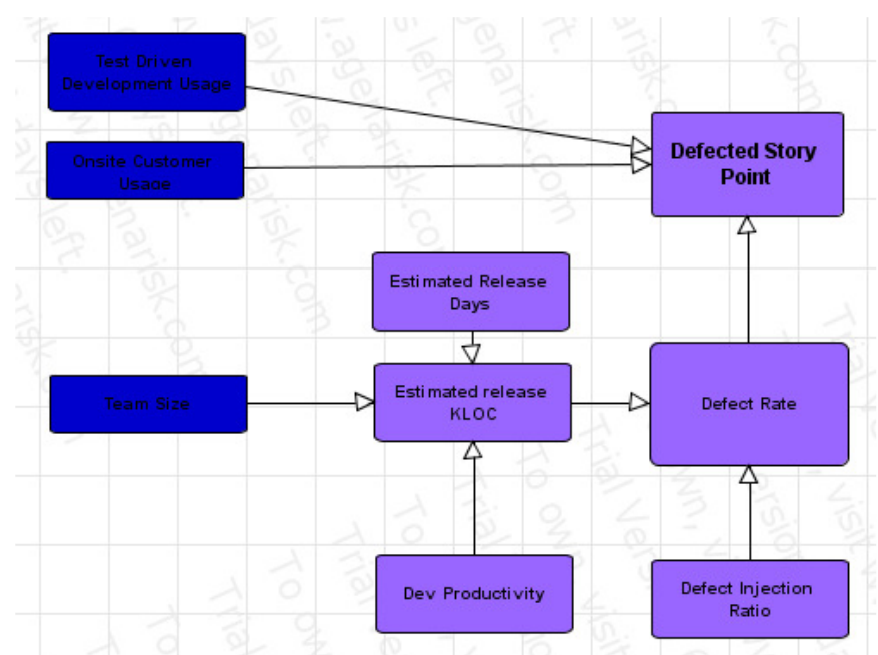
This model calculates an estimate number for the defected story points to be redeveloped in the next release. This number is affected by two XP practices: Test Driven development and Onsite Customer practices. Different components of the model are described as follows:

\

  • Dev. Productivity: The developer productivity measured as the number Line Of Code (LOC) per day. According to the literature [4], a normal distribution with mean 40 and Standard Deviation of 20 represents this value.

    \

  • Estimated Release KLOC: represents the number of KLOC produced from this release. This value is calculated as the product of multiplying Dev. Productivity times Team size times Estimated Release Days.

    \

  • Defect Injection Ratio: represents the number of defects per KLOC. This value was set to a normal distribution with mean 20 and standard deviation 5 [4].

    \

  • Defect Rate: represents the number of defects in this release. It is calculated as the multiplication of the Estimated Release KLOC times Defect Injection Ratio.

    \

  • Defected Story Points: This value represents the number of defected story points to be re-developed in the next release taking into account the impact of two XP practices: Test Driven development and Onsite Customer practices (Equation 3). OSCImpactFactor and TDDImpactFactor represent the impact of the Onsite Customer and Test Driven development practices on reducing the defect rate. According to the literature, there values were set to 0.8 and 0.4 respectively [3],[4]. More details regarding the impact of these practices in the defect rate are available in the Background section.

\ DefectedStoryPoints = DefectRate*(1- OSCImpactFactor * onsitecustomerusage )*(1 TDDImpactFactor *tddusage) Equation (3)

\ Figure 5 Defected Story Points Model
\

:::info Authors:

(1) Mohamed Abouelelam, Software System Engineering, University of Regina, Regina, Canada;

(2) Luigi Benedicenti, Software System Engineering, University of Regina, Regina, Canada.

:::


:::info This paper is available on arxiv under CC BY-NC-ND 4.0 DEED license.

:::

\

سلب مسئولیت: مقالات بازنشر شده در این سایت از پلتفرم‌ های عمومی جمع‌ آوری شده‌ اند و صرفاً برای اهداف اطلاع‌ رسانی ارائه می‌ شوند. این مطالب لزوماً بیانگر دیدگاه‌ های MEXC نیستند. کلیه حقوق متعلق به نویسندگان اصلی محتوا است. اگر معتقدید که محتوایی حقوق اشخاص ثالث را نقض می‌ کند، لطفاً برای حذف آن با آدرس ایمیل service@support.mexc.com تماس بگیرید. MEXC هیچگونه تضمینی در مورد دقت، کامل بودن یا به‌ روز بودن محتوای ارائه‌ شده نمی‌ دهد و مسئولیتی در قبال هرگونه اقدام بر اساس این اطلاعات ندارد. این محتوا مشاوره مالی، حقوقی یا حرفه‌ ای محسوب نمی‌ شود و نباید آن را به‌ عنوان توصیه یا تأیید از سوی MEXC تلقی کرد.
اشتراک گذاری مقاله

محتوای پیشنهادی

YZY token aftermath sees 105 traders lose $100k-$1M each in $75M wipeout

YZY token aftermath sees 105 traders lose $100k-$1M each in $75M wipeout

The post YZY token aftermath sees 105 traders lose $100k-$1M each in $75M wipeout appeared on BitcoinEthereumNews.com. Kanye West’s YZY token launch has left 105 traders with significant losses between $100,000 and $1 million each, totaling $26 million in combined losses at an average of $250,000 per wallet. According to data shared by Bubblemaps analysis published on Aug. 27, 70,201 traders interacted with the token, resulting in 51,862 tanking losses. West’s controversial token launch on Solana reached a market capitalization over $3 billion before collapsing by over 90% within hours. Data reveals stark inequality in outcomes, with only 11 wallets (0.015%) generating profits exceeding $1 million each. These successful traders captured $18.9 million in combined gains. The loss distribution shows that traders with larger positions bore the heaviest burden. Wallets losing between $10,000 and $100,000 totaled roughly $25.4 million, with 917 addresses sharing an average loss of $27,700. An additional 4,244 traders lost between $1,000 and $10,000, with an average loss of $3,000, resulting in over $13 million. At the extreme end, three traders each lost more than $1 million, resulting in a combined loss of $5.07 million. Only 1% of wallets earned substantial profits Of the 70,201 traders, only 18,333 achieved profitability, representing 26% of total participants. Yet, nearly 86% of them generated profits of up to $1,000, totaling around $1.65 million, with an average profit of $105 for each trader in this cohort. Less than 1% (642 wallets) of the traders generated profits exceeding $10,000 each, capturing a combined gain of $58.8 million, which represents nearly 88% of the total profits. Additionally, 88 traders earned between $100,000 and $1 million each, totaling $24.9 million. Contributing to traders’ losses were structural disadvantages, including 94% insider-controlled initial supply and prohibitive fee structures. The YZY pool operated with a 1% base fee that quickly adjusted to 2.68%; combined with slippage costs, this resulted in an estimated 10% round-trip…
اشتراک
BitcoinEthereumNews2025/08/28 07:08
اشتراک