Bitcoin Is Repeating a Familiar Pattern And History Hasn’t Been Kind
After reviewing the latest long-term Bitcoin chart shared by Crypto Patel, one structural detail stands out immediately.
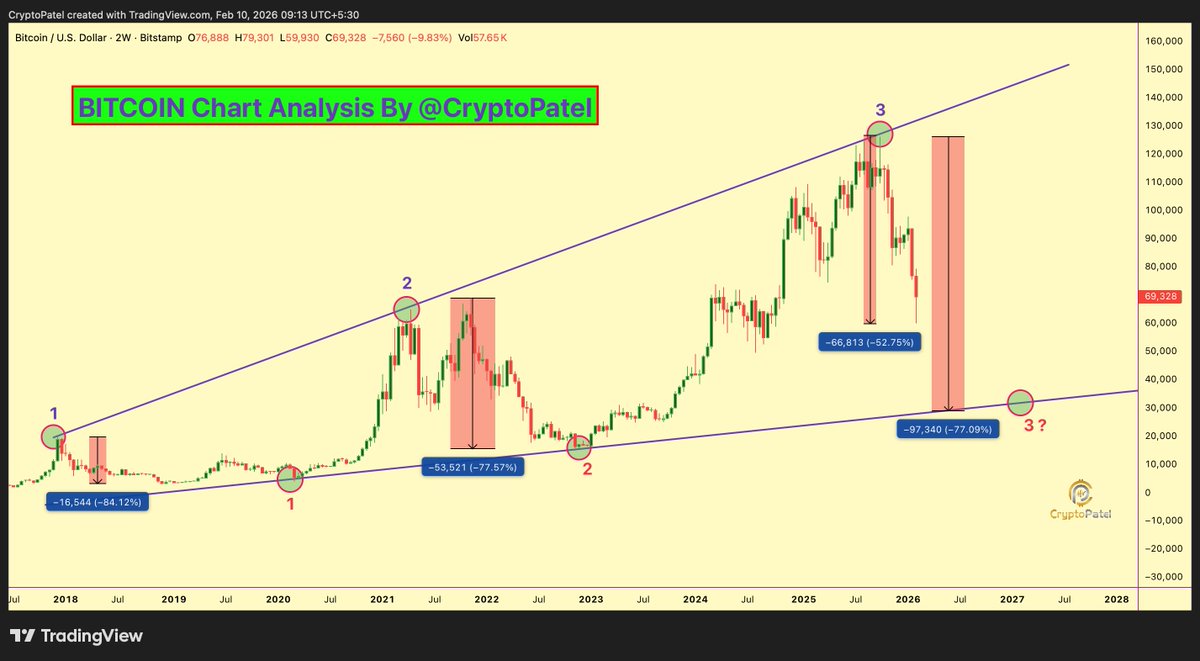
Bitcoin appears to be tracing a price path that closely mirrors prior cycle peaks, specifically those seen in 2017 and 2021. While market conditions differ across cycles, the underlying price behavior shows striking similarities that historically preceded sharp corrective phases.
A Pattern That Has Appeared Before Major Corrections
In both 2017 and 2021, Bitcoin entered a steep parabolic advance that pushed price far above its long-term trend channel. Each time, this vertical acceleration was followed by a violent mean reversion. In 2017, the correction exceeded 80%. In 2021, Bitcoin retraced more than 75% from peak to trough.
 Source: https://x.com/CryptoPatel/status/2021078925133451571
On the current chart, Bitcoin once again sits near the upper boundary of a rising long-term channel. The structure shows three comparable expansion phases across cycles, with each previous instance ending in a deep pullback toward the lower channel support. The current price action suggests Bitcoin may be entering the same late-stage behavior, where upside momentum slows while downside risk grows asymmetrically.
Why This Phase Catches Most Traders Off Guard
Parabolic moves tend to create a false sense of stability near the top. Price often chops sideways rather than collapsing immediately, giving market participants time to rationalize continuation. Historically, this period is where positioning becomes crowded, leverage builds, and downside vulnerability quietly increases.
The chart highlights how prior breakdowns did not start with a single crash candle. Instead, they began with failed continuation attempts, followed by sharp drawdowns once support levels gave way. This behavior aligns with the current structure, where price remains elevated but momentum no longer expands at the same rate.
What History Suggests Without Certainty
If Bitcoin were to follow the same historical rhythm, the next phase would involve a deeper corrective move back toward long-term structural support. That does not imply inevitability, nor does it define timing. However, it does suggest that risk-reward dynamics may be shifting away from aggressive upside chasing and toward capital preservation.
Importantly, previous cycles show that these corrective phases were not the end of Bitcoin’s long-term trend. Instead, they served as the reset that allowed the next expansion to begin. Investors who survived those drawdowns with discipline often found themselves positioned for the following cycle’s growth.
The Bigger Picture
Bitcoin has a long history of punishing complacency near cycle extremes while rewarding patience during periods of maximum uncertainty. The reappearance of a familiar structural pattern does not guarantee the same outcome, but it does warrant attention.
As past cycles have shown, the most important decisions are often made before volatility explodes not after.
The post Bitcoin Is Repeating a Familiar Pattern And History Hasn’t Been Kind appeared first on ETHNews.
추천 콘텐츠

Shifting Tides in Bitcoin: New Challenges Emerge

We see a very good partnership with Venezuela