Solana launched in March 2020 at just $0.22 — and less than five years later, it hit a peak near $295. If you've ever looked at a Solana price history chart and wondered what actually drove thoseSolana launched in March 2020 at just $0.22 — and less than five years later, it hit a peak near $295. If you've ever looked at a Solana price history chart and wondered what actually drove those
Learn/Cryptocurrency Knowledge/Hot Concepts/Solana Pric...l-Time High

Solana Price History: The Complete SOL Chart From Launch to All-Time High

Intermediate
Mar 17, 2026Emma Williams
0m
Solana
SOL$94.83+0.19%
NEAR
NEAR$1.4635+1.87%
LightLink
LL$0.003397-0.02%
ANyONe Protocol
ANYONE$0.1332-1.47%
AINFT
NFT$0.0000003351+0.75%
Solana launched in March 2020 at just $0.22 — and less than five years later, it hit a peak near $295.
If you've ever looked at a Solana price history chart and wondered what actually drove those dramatic swings, this article breaks it all down.
You'll get a year-by-year breakdown of SOL/USD prices, the key events behind the biggest moves, and what those patterns mean for anyone thinking about buying SOL today.

Key Takeaways
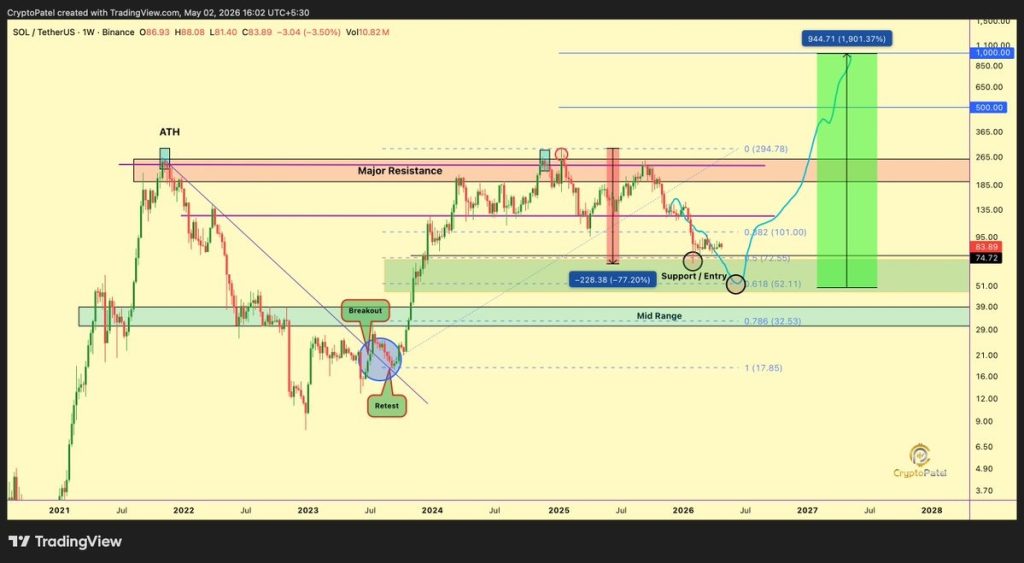
  • SOL launched at $0.22 in March 2020 and reached an all-time high of approximately $295 in January 2025, marking one of crypto's most dramatic price runs.
  • The 2021 bull run — driven by NFT launches and DeFi adoption — pushed SOL up over 11,000% in a single year.
  • The FTX collapse in November 2022 erased nearly 97% of SOL's value, dropping it from ~$260 to a low near $8.
  • Solana's recovery was anchored by real institutional signals: Visa expanded USDC settlement to the Solana blockchain in September 2023.
  • SOL hit a new cycle ATH near $295 in early 2025, coinciding with the launch of spot Solana ETFs backed by major financial institutions.
  • SOL's price history shows a pattern of deep drawdowns followed by strong recoveries — but past performance does not guarantee future results.

Solana Price History by Year: The Complete SOL Timeline

The Solana coin price history reads like a rollercoaster — record highs, catastrophic crashes, and a comeback few expected.
Here's the full picture, year by year.

2020 — The Quiet Launch

SOL debuted via a public sale on CoinList at $0.22 in March 2020, and quickly began trading above its sale price.
By July, it crossed $2 — nearly ten times the sale price within a few months.
By the end of 2020, SOL had climbed past the $1 mark — a quiet but meaningful start for a brand-new network.

2021 — The Bull Run That Changed Everything

This was Solana's breakout year, and the Solana price history 2021 numbers are staggering.
SOL started the year under $2 and ended it above $170 — a gain of over 11,000% according to CoinCodex.
The Degenerate Ape Academy NFT collection launched in August and immediately pushed SOL past $60.
By November, it hit an all-time high of approximately $260, driven by explosive DeFi adoption, developer growth, and widespread NFT activity across the ecosystem.

2022 — The FTX Collapse and the Bear Market Floor

The Solana price history 2022 is defined by one event: the implosion of FTX in November.
FTX and its trading arm Alameda Research held hundreds of millions of dollars worth of SOL, and when the exchange collapsed, mass liquidations followed almost immediately.
SOL fell from roughly $30 to below $15 within days, and by December had bottomed near $8.13 — a roughly 97% decline from its 2021 peak, per CoinMarketCap data.

2023 — The Quiet Rebuild

While the broader market remained cautious, Solana's developers kept building.
A BONK memecoin airdrop in January spiked daily active wallets across the network.
Then in September, Visa announced live USDC settlement running on the Solana blockchain — a major institutional credibility signal.
By the end of 2023, SOL had climbed back above $100, closing the year near $109 according to CoinGecko.

2024 — Memecoins, Institutions, and a New Bull Cycle

The Solana price history 2024 was fueled by a memecoin supercycle and growing institutional interest.
Platforms like Pump.fun made it trivially easy to launch tokens on Solana, generating massive on-chain activity that attracted both retail traders and larger capital.
SOL pushed above $200 for the first time since the 2021 peak, as investor confidence continued building heading into year-end.

2025 — A New All-Time High

On January 19, 2025, Solana hit its all-time high price history peak: approximately $293–295 depending on the source, per CoinGecko and CoinCodex.
The rally coincided with the launch of spot Solana ETFs, with issuers like Bitwise and Fidelity seeing strong early inflows, and total Solana ETF assets surpassing $1 billion, according to CoinGecko.


What Drove Solana's Biggest SOL Price Moves

Not every price swing had the same cause. Understanding the why behind the Solana price history chart is just as important as tracking the numbers.

NFTs and DeFi Lit the First Fuse

The August 2021 launch of the Degenerate Ape Academy collection sold out in eight minutes and generated $5.9 million in volume, according to CoinMarketCap.
That event pushed SOL above $60 and sparked a wider narrative: Solana was fast, cheap, and ready for mass adoption in a way that Ethereum simply wasn't at the time.
DeFi protocols followed, adding billions in total value locked and reinforcing that narrative through the rest of 2021.

The FTX Collapse Redefined the Floor

The forced liquidation of those positions — combined with fear of wider contagion — erased the network's entire bull-run gains almost overnight.
What made the crash so severe was the perception problem: many labeled Solana an "FTX coin," and rebuilding that trust took the better part of two years.

Institutional Entry and ETF Approval Fueled the 2025 ATH

By late 2024 and into 2025, the story shifted from retail speculation to institutional adoption.
Spot Solana ETFs launched in late 2025, with Goldman Sachs disclosing over $107 million in exposure, according to CoinGecko.
That institutional endorsement, combined with an already active memecoin ecosystem on-chain, pushed SOL to its Solana all time high price history of roughly $293–295 in January 2025.


Solana Price History Chart: Key SOL/USD Levels to Know

For anyone studying the Solana price history graph, a few specific numbers anchor the entire story.

All-Time Low — $0.50 (May 2020)

Anyone who bought at that level and held to the 2025 peak would have seen extraordinary returns — a figure that illustrates both the opportunity and the extreme volatility inherent in early-stage crypto assets.

First Cycle ATH — ~$260 (November 2021)

Solana's first major all-time high came in November 2021, when SOL/USD briefly touched approximately $259–260, according to CoinGecko historical data.
That peak was driven by the combination of NFT mania, DeFi growth, and a broader crypto bull market that lifted nearly every major asset.
It remained the highest SOL had ever traded until the new cycle pushed past it in late 2024.

Bear Market Bottom — ~$8 (December 2022)

The lowest point of the post-FTX crash came in December 2022, with SOL bottoming near $8.13 according to CoinMarketCap.
From that low, Solana's recovery to the 2025 ATH of ~$295 marked one of the more dramatic single-cycle recoveries in the history of top-ten cryptocurrencies.

Current Cycle ATH — ~$295 (January 2025)

Solana's most recent Solana price history peak of approximately $293–295 was recorded on January 19, 2025, according to CoinGecko.
Since that peak, SOL has pulled back as broader market conditions shifted and FTX estate token unlocks added selling pressure — a reminder that even the strongest assets can face significant headwinds after major highs.


What the Solana SOL Price History Tells Us About Buying

The Solana SOL price history is not a straight line — it never has been, and it likely never will be.
What it does show is a pattern of deep crashes followed by meaningful recoveries, with each cycle tending to set a higher floor than the last.
SOL fell 97% from its 2021 high and still came back to set a new all-time high in 2025.
That's not a guarantee of future performance, but it does say something about the durability of the network and the commitment of its developer community.
The risk is just as real, though — timing matters enormously in a market this volatile, and investors who bought near the 2021 peak waited over three years to return to even.
If you're researching the Solana price history chart to inform a buy decision, the most honest takeaway is this: SOL rewards patience and punishes leverage.
You can start trading SOL and track live price movements on MEXC.


Frequently Asked Questions

What is the all-time high for Solana?
Solana reached its all-time high of approximately $293–295 on January 19, 2025, according to CoinGecko.


What was Solana's price when it launched?
SOL launched via a public CoinList sale in March 2020 at $0.22 per token.


What is Solana's all-time low price?
Solana's all-time low was $0.5008, recorded on May 11, 2020, according to CoinGecko.


Why did Solana's price crash in 2022?
The FTX collapse triggered forced liquidations of hundreds of millions in SOL holdings, wiping out most of the 2021 gains and pushing the price below $10.


Is Solana a good investment?
SOL has historically recovered from deep drawdowns, but it remains a highly volatile asset — always conduct your own research before investing.


Where can I trade SOL?
You can buy and trade Solana (SOL) on MEXC with a spot trading fee of 0% maker and 0.05% taker.


Conclusion

Solana's journey from a $0.22 ICO to a nearly $295 all-time high is one of the more compelling stories in crypto — marked by explosive growth, a near-fatal crash, and a recovery that most didn't see coming.
Understanding that Solana price history helps you put today's price in context, whether you're a first-time buyer or just trying to make sense of what you're seeing on the chart.
For live SOL/USD prices and trading, visit MEXC.
Market Opportunity
Solana Logo
Solana Price(SOL)
$94.83
$94.83$94.83
+1.06%
USD
Solana (SOL) Live Price Chart
Sign Up on MEXC
Sign Up & Receive Up to 10,000 USDT Bonus