

TrueFi (TRU) Price Explodes 160%—Is it a Breakout or a Low-Liquidity Trap?

The post TrueFi (TRU) Price Explodes 160%—Is it a Breakout or a Low-Liquidity Trap? appeared first on Coinpedia Fintech News
TrueFi (TRU) price is up by more than 157%, reaching $0.01112 from the lows of $0.0042 with a mammoth increase in the volume of nearly 8400%. This explosive move appears primarily driven by a massive, coordinated liquidity surge, as no specific catalyst was visible in the provided data. The token is one of the top performers in the crypto market, with the market cap reaching close to $17 million.
The move comes after months of decline, low liquidity, and weak participation, raising a key question for the traders: Is this the start of a trend reversal or just a short-term liquidity-driven spike?
Why is TrueFi (TRU) Price Rising Today?
TrueFi (TRU) price is rising sharply, driven by a surge in trading activity and a breakout from a prolonged downtrend. The token has gained over 90% in a single session, with trading volume jumping more than 2,000% to over $40 million, highlighting a sudden influx of liquidity. With a relatively small market cap of around $15–20 million, even moderate capital inflows can trigger outsized price movements, especially when combined with technical breakout signals.
- Price surged ~90% intraday, signaling aggressive momentum
- Trading volume spiked 2,000%+ to ~$40M–$160M, indicating strong participation
- Market cap remains low (~$15M–$20M), amplifying volatility
- Breakout above descending channel resistance near $0.005–$0.006 triggered buying
- Short-term targets now seen around $0.012–$0.015, driven by momentum expansion
This move is being driven by liquidity and momentum, and its sustainability will depend entirely on whether volume and participation continue to hold.
TRU Price Breaks Out After Prolonged Downtrend
TrueFi (TRU) price has recorded a sharp breakout, surging nearly 90% in a single session after months of sustained downside pressure. The move comes after an extended consolidation phase within a descending channel, where price remained suppressed under key moving averages. This sudden expansion in price and volume signals a potential shift in short-term momentum, attracting trader attention across the market.
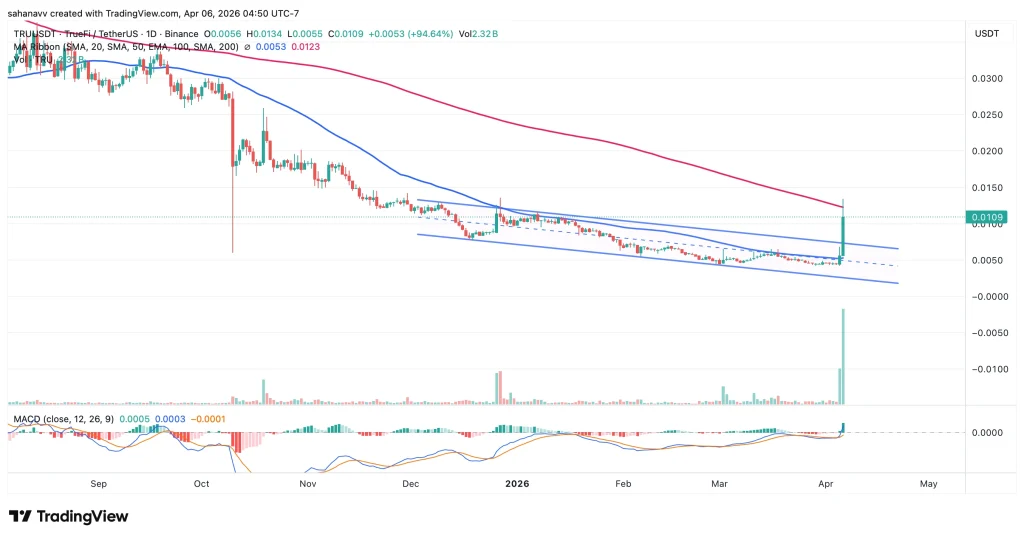
The chart shows TRU trading inside a well-defined descending channel for several months, consistently forming lower highs and lower lows. This structure reflects a prolonged bearish trend, reinforced by price staying below major moving averages, including the 100- and 200-day levels, which continue to slope downward.
The recent breakout above the channel resistance marks the first structural change in this trend. Price has moved sharply from the $0.005–$0.006 range to above $0.010, supported by a significant spike in volume. This indicates strong participation rather than a low-liquidity move.
Momentum indicators are also shifting:
- MACD turning positive → bearish momentum fading
- Volume expansion → confirms strength behind the move
- Price reclaiming short-term moving averages → early sign of recovery
However, the broader trend remains cautious, as TRU is still trading below higher timeframe resistance zones and long-term moving averages. This suggests the move is currently a short-term momentum breakout rather than a confirmed trend reversal.
Wrapping it Up- Key Levels to Watch
TRU’s breakout has shifted short-term momentum, but sustainability now depends on holding above the breakout zone. Immediate support lies at $0.008–$0.009, while a loss of this level could drag the price back toward $0.006–$0.0055. On the upside, if momentum sustains, the TrueFi price could target $0.012, followed by a key resistance near $0.014–$0.015, where previous supply is likely to re-enter.


You May Also Like

Sharps Technology’s Strategic Masterstroke: Holding 2M SOL Earns Impressive 7% Annual Staking Yield

XRP price prediction as total addresses spike past 8 million


