

Grayscale’s Crypto Large Cap Fund, Including BTC, ETH, XRP, ADA, Gets SEC Approval
Crypto asset manager Grayscale secured a major victory as the US Securities and Exchange Commission (SEC) approved the crypto large-cap fund (GDLC). This fund will hold the top five digital assets by market cap, such as Bitcoin BTC $117 165 24h volatility: 0.6% Market cap: $2.33 T Vol. 24h: $58.16 B , Ethereum ETH $4 581 24h volatility: 2.1% Market cap: $552.78 B Vol. 24h: $42.37 B , XRP XRP $3.11 24h volatility: 3.3% Market cap: $185.83 B Vol. 24h: $7.49 B , Solana SOL $246.0 24h volatility: 4.9% Market cap: $133.48 B Vol. 24h: $11.31 B , and Cardano ADA $0.91 24h volatility: 5.0% Market cap: $33.34 B Vol. 24h: $2.53 B , and shall debut soon on the New York Stock Exchange (NYSE).
Grayscale’s Crypto Large Cap Fund Makes Way to NYSE
Following the latest SEC approval, the Grayscale GDLC fund will start trading on NYSE Arca. The launch of this fund on Wall Street can lead to strong institutional interest. Speaking on the development, Grayscale CEO Peter Mintberg said:
“Grayscale Digital Large Cap Fund $GDLC was just approved for trading along with the Generic Listing Standards. The Grayscale team is working expeditiously to bring the *FIRST* multi crypto asset ETP to market with Bitcoin, Ethereum, XRP, Solana, and Cardano.”
Bitcoin accounts for more than 72% of the fund’s portfolio, followed by Ethereum at over 17%. XRP, Solana, and Cardano carry allocations of 5.62%, 4.03%, and 1%, respectively. Grayscale recently trimmed its BTC weighting to boost exposure to the other assets.
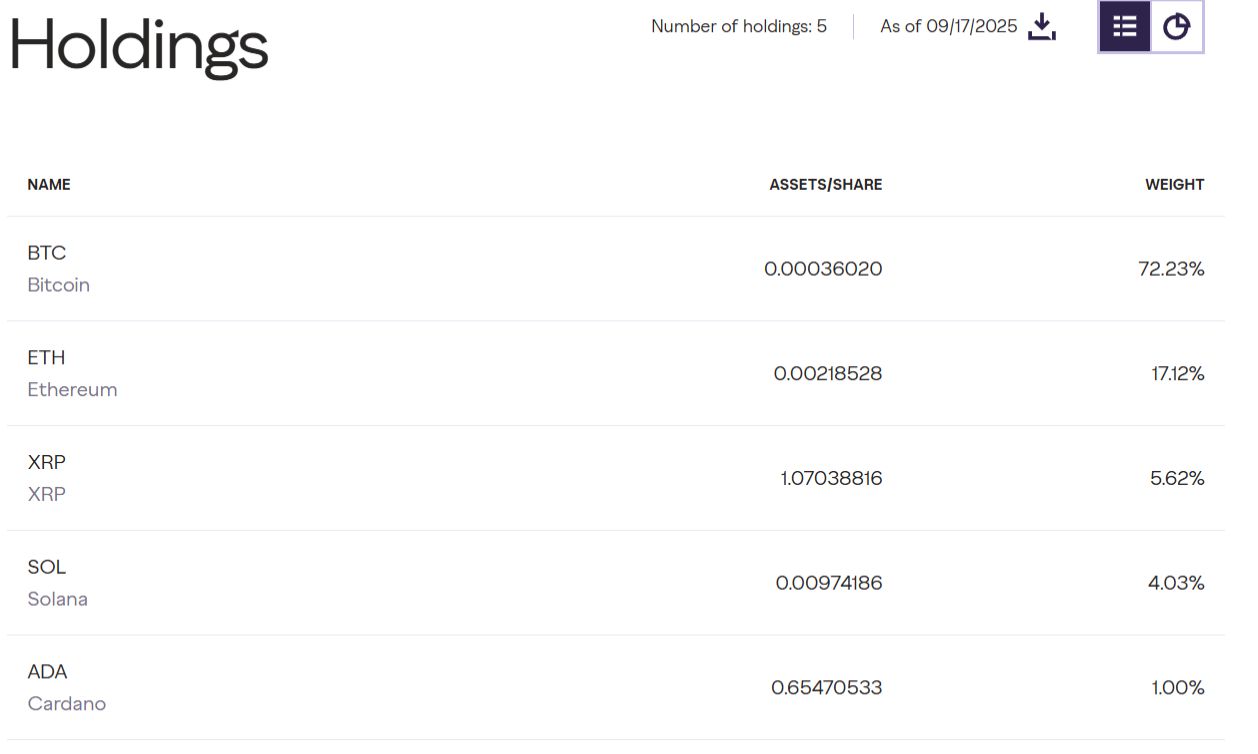
Grayscale Crypto Large Cap Fund | Source: Grayscale
ETF specialist Nate Geraci credited Grayscale for paving the way for crypto ETFs through its legal challenge against the SEC. He added that the approval of the large-cap fund GDLC could open the gates for multi-asset crypto ETFs, from other asset managers.
Earlier this year, in July, the US securities regulator postponed its decision on Grayscale’s proposal to convert the Digital Large Cap Fund (GDLC) from an over-the-counter product into an exchange-listed ETP on NYSE Arca, citing the need for additional review.
With the Generic Listing Standards now in place, the process is expected to be more streamlined. It potentially paves the way for additional crypto ETPs.
Grayscale Pushes for Spot ETFs for LINK, AVAX, ADA
Digital asset manager Grayscale has been pushing to bring different crypto exchange-traded funds (ETFs). Its recent application targets some of the emerging crypto assets like Chainlink LINK $24.19 24h volatility: 4.5% Market cap: $16.39 B Vol. 24h: $1.37 B , Avalanche AVAX $32.80 24h volatility: 9.6% Market cap: $13.85 B Vol. 24h: $1.80 B , and Cardano ADA $0.91 24h volatility: 5.0% Market cap: $33.34 B Vol. 24h: $2.53 B .
Grayscale has filed a Form S-1 to convert its Chainlink Trust (LINK) into an exchange-traded fund, the Grayscale Chainlink Trust ETF, which is expected to trade on NYSE Arca under the ticker GLNK.
nextThe post Grayscale’s Crypto Large Cap Fund, Including BTC, ETH, XRP, ADA, Gets SEC Approval appeared first on Coinspeaker.
You May Also Like

Dropee Daily Combo Revealed March 19, 2026: Unlock Free Coins Instantly!

Xenea Wallet Daily Quiz March 19, 2026: Claim Your Free Crypto Coins Now

