Aster (ASTER), a cryptocurrency powering an exchange for decentralized perpetual contracts, has gone up by triple digits in a single day. Currently trading above the $0.47 mark, the utility crypto has surged by over 457% in the last 24 hours. The surge in Aster’s price recently has led the community to ask whether the momentum […]Aster (ASTER), a cryptocurrency powering an exchange for decentralized perpetual contracts, has gone up by triple digits in a single day. Currently trading above the $0.47 mark, the utility crypto has surged by over 457% in the last 24 hours. The surge in Aster’s price recently has led the community to ask whether the momentum […]

Aster Price Prediction – Low Cap Crypto Explodes 457%

2025/09/18 20:52

Aster (ASTER), a cryptocurrency powering an exchange for decentralized perpetual contracts, has gone up by triple digits in a single day. Currently trading above the $0.47 mark, the utility crypto has surged by over 457% in the last 24 hours.

The surge in Aster’s price recently has led the community to ask whether the momentum will continue or if a major drop-off may be coming soon. This article gives a proper forecast, both short term and long term, for the Aster price, before providing insight into another crypto with similar potential.

Aster Price Surges By Triple Digits: Will It Explode Further?

Following the launch of Aster on Aster Spot after the token generation event, the price of the token has surged at an unprecedented level, though this is expected for a token that has just been listed.

https://twitter.com/Aster_DEX/status/1968595875573407935

The hourly charts show that the Aster price has now started to consolidate around the $0.47 level after a surge of more than 400%.

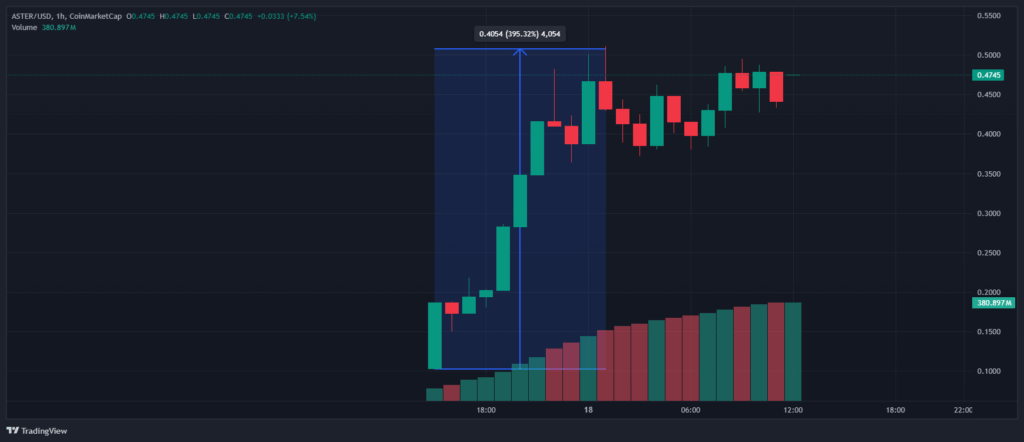
The reason behind this price action is clear: listing. This means it is unlikely that the momentum will hold. However, Aster is powering a decentralized perpetual exchange. Among traders, this could be a strong utility that provides the token with long-term upside.

What is Aster?

Aster is the native crypto of Aster DEX, a decentralized exchange for perpetual contracts. According to the website, the DEX allows users to trade stocks cross-chain and with hidden orders.

It has upwards of 2 million users already, according to its claims, and its trading volume is more than $516 billion.

Among all the perks the platform offers, the “invisible order” feature seems to be its biggest advantage. Hidden orders reportedly let users place limit orders that remain fully hidden from the public order book. This method of anonymous trading is suitable for many investors who want to keep their crypto trades private.

It also supports spot trading and portfolio management. Aster features a reward hub with its own “Trade and Earn” program, along with competitions, all of which give the project an engaging look that could translate to long-term gains for Aster investors.

Aster Price Prediction: Short-Term and Long-Term

Since the Aster token has gone live only recently, users need to be very careful, as much of the growth seen today could be corrected within the next few days. Based on these factors, here are the short-term and long-term price predictions for the token.

Short-Term Price Prediction

In the short term, investors could expect the Aster token to rise further. However, the excitement of the listing pump is over, which can already be seen on the hourly charts. Investors now have only minor upticks to rely on, bolstered by social media posts and competitions. After a while, however, the cryptocurrency’s price could correct. The degree of correction will depend on macroeconomic conditions.

Long-Term Price Prediction

In the long term, Aster’s use cases will play a key role in determining how the token performs on the price chart. Much will depend on the level of traction the decentralized exchange is able to gain. If it attracts more customers, newcomers may also want to explore the advantages that holding the Aster token provides.

The bottom line is that it is difficult to give a reliable long-term price forecast for Aster because the token has only just entered the market. Its price action will depend on both macroeconomic conditions and the project’s own use cases.

Best Wallet Token is Another Crypto with Similar Potential

Much of the traction Aster has gained is because Aster DEX has already been an active product. This is evident from its reported 5 million users and more than $516 billion in daily volume.

However, the listing gains are gone. For those still seeking early gains, Best Wallet Token is worth considering.

Best Wallet Token is the cryptocurrency that powers Best Wallet, an already-active wallet supporting more than 90 blockchains. Thanks to enhanced security features powered by Fireblocks MPC technology, along with cross-chain swaps and multi-chain functionality, Best Wallet Token has managed to amass a large following. It has even gained attention from the New York Post, which named it a top cryptocurrency app.

The token is an integral part of the ecosystem, offering users additional perks such as increased staking rewards, discounts when buying crypto, and community governance. Best Wallet Token’s unique benefit is also access to a launchpad, which allows users to buy presale cryptos while they are still at the 0 stage.

The Best Wallet ecosystem has also gone through multiple updates recently, including the addition of Solana blockchain support, Bitcoin swaps, and a gamified system that rewards users for simply opening the app.

Best Wallet Token has also been one of the most popular cryptos to buy in presale. The presale has raised close to $16 million already, and analysts have said it has 100x potential.

Visit Best Wallet Token

This article has been provided by one of our commercial partners and does not reflect Cryptonomist’s opinion. Please be aware our commercial partners may use affiliate programs to generate revenues through the links on this article.

Disclaimer: The articles reposted on this site are sourced from public platforms and are provided for informational purposes only. They do not necessarily reflect the views of MEXC. All rights remain with the original authors. If you believe any content infringes on third-party rights, please contact service@support.mexc.com for removal. MEXC makes no guarantees regarding the accuracy, completeness, or timeliness of the content and is not responsible for any actions taken based on the information provided. The content does not constitute financial, legal, or other professional advice, nor should it be considered a recommendation or endorsement by MEXC.

You May Also Like

XLM Price Prediction: Stellar Eyes $0.32 Recovery Target Within 30 Days Amid Technical Oversold Conditions

XLM Price Prediction: Stellar Eyes $0.32 Recovery Target Within 30 Days Amid Technical Oversold Conditions

The post XLM Price Prediction: Stellar Eyes $0.32 Recovery Target Within 30 Days Amid Technical Oversold Conditions appeared on BitcoinEthereumNews.com. James Ding Nov 18, 2025 10:25 XLM price prediction suggests a potential 28% rally to $0.32 resistance as oversold RSI conditions and analyst forecasts converge on near-term recovery prospects for Stellar. XLM Price Prediction Summary • XLM short-term target (1 week): $0.28 (+12% from current $0.25) • Stellar medium-term forecast (1 month): $0.30-$0.35 range representing 20-40% upside • Key level to break for bullish continuation: $0.29 resistance (middle Bollinger Band) • Critical support if bearish: $0.24 immediate support, then $0.22 major support Recent Stellar Price Predictions from Analysts The latest XLM price prediction consensus from major analysts shows remarkable alignment around the $0.28-$0.33 range for near-term targets. Changelly and CoinLore both forecast XLM reaching approximately $0.27-$0.274 by November 18, 2025, representing modest 8-10% gains from current levels. More optimistic Stellar forecast projections come from Blockchain.News, targeting $0.31-$0.35 within four weeks, while CoinDCX anticipates $0.33 by month-end. The most bullish long-term XLM price prediction comes from Rivalry at $1.02 average for 2025, though this appears disconnected from current technical realities. DigitalCoinPrice’s $0.54 year-end target and Capital.com’s $0.41 average forecast provide middle-ground perspectives, suggesting analysts see significant upside potential despite current bearish momentum. The consensus XLM price target of $0.29 resistance represents a critical technical level that aligns with multiple analyst projections. XLM Technical Analysis: Setting Up for Oversold Bounce Current Stellar technical analysis reveals XLM trading near oversold territory with an RSI of 33.34, approaching the traditional oversold threshold of 30. This positioning often precedes short-term bounces, particularly when combined with XLM’s current location near the lower Bollinger Band at $0.24. The MACD histogram reading of -0.0017 indicates bearish momentum is weakening, while the Stochastic oscillator shows extreme oversold conditions with %K at 11.16 and %D at 7.87. These momentum indicators suggest XLM…
Share
BitcoinEthereumNews2025/11/19 23:36
Tether Dominance Surges to 6% — A Red Flag for the Market?

Tether Dominance Surges to 6% — A Red Flag for the Market?

The post Tether Dominance Surges to 6% — A Red Flag for the Market? appeared on BitcoinEthereumNews.com. In November 2025, the Tether Dominance index (USDT.D) — the share of USDT’s market cap relative to the total crypto market cap — officially surpassed 6%. It also broke above a descending trendline that had remained intact since 2022. Analysts have expressed concern as USDT.D breaks a long-term resistance level. The move often signals the beginning of a major correction or even an extended bear market for the entire crypto market. How Significant Is the Rise of USDT.D in the Market Context of November? TradingView data shows that USDT.D reached 6.1% on November 18 before pulling back to 5.9%. Sponsored Sponsored Earlier in the month, this metric sat below 5%. The increase reflects heightened caution among investors. Many have rotated capital into the most liquid stablecoin instead of deploying funds to buy deeply discounted altcoins. USDT.D vs. Total Market Cap. Source: TradingView Historical data indicate a strong inverse correlation between USDT.D and total market capitalization. Therefore, USDT.D breaking above a trendline that has held for nearly four years may signal deeper market-wide declines ahead. Several analysts expect USDT.D to climb toward 8% by the end of the year, implicitly suggesting that a bear market may be forming in November. This projection has merit because fear continues to grow and shows no signs of easing. In addition, the well-known analyst Milk Road highlights a notable shift in the stablecoin market. DefiLlama data shows that the total stablecoin market cap fell from $309 billion at the end of October to $303.5 billion in November. Stablecoin Market Cap. Source: DefiLlama. The stablecoin market has shed approximately $5.5 billion in less than a month. This marks the first significant decline since the 2022 bear market. The DefiLlama chart reveals that, after four years of continuous growth, the curve has flattened and is starting to…
Share
BitcoinEthereumNews2025/11/19 23:28