

Solana (SOL) Price: SOL Eyes $100 Breakout — Here’s the Level Traders Are Watching
TLDR
- SOL is trading near $87–$88, above its 50-day EMA, with resistance at $90–$94
- Analyst Ali Martinez flagged a tight Bollinger Band squeeze between $77 and $94 on the 3-day chart
- SOL ETFs recorded $9.44 million in net weekly inflows, with five straight days of net inflows totaling ~$1.45 billion
- Goldman Sachs disclosed a ~$108 million SOL position
- A confirmed close above $94 could open the path toward $100; a drop below $77 may extend weakness
Solana (SOL) is trading near $87–$88 on Monday, holding above its 50-day Exponential Moving Average (EMA) at $87.04. The price has recovered from a recent low near $84.55 and is testing a key resistance zone.
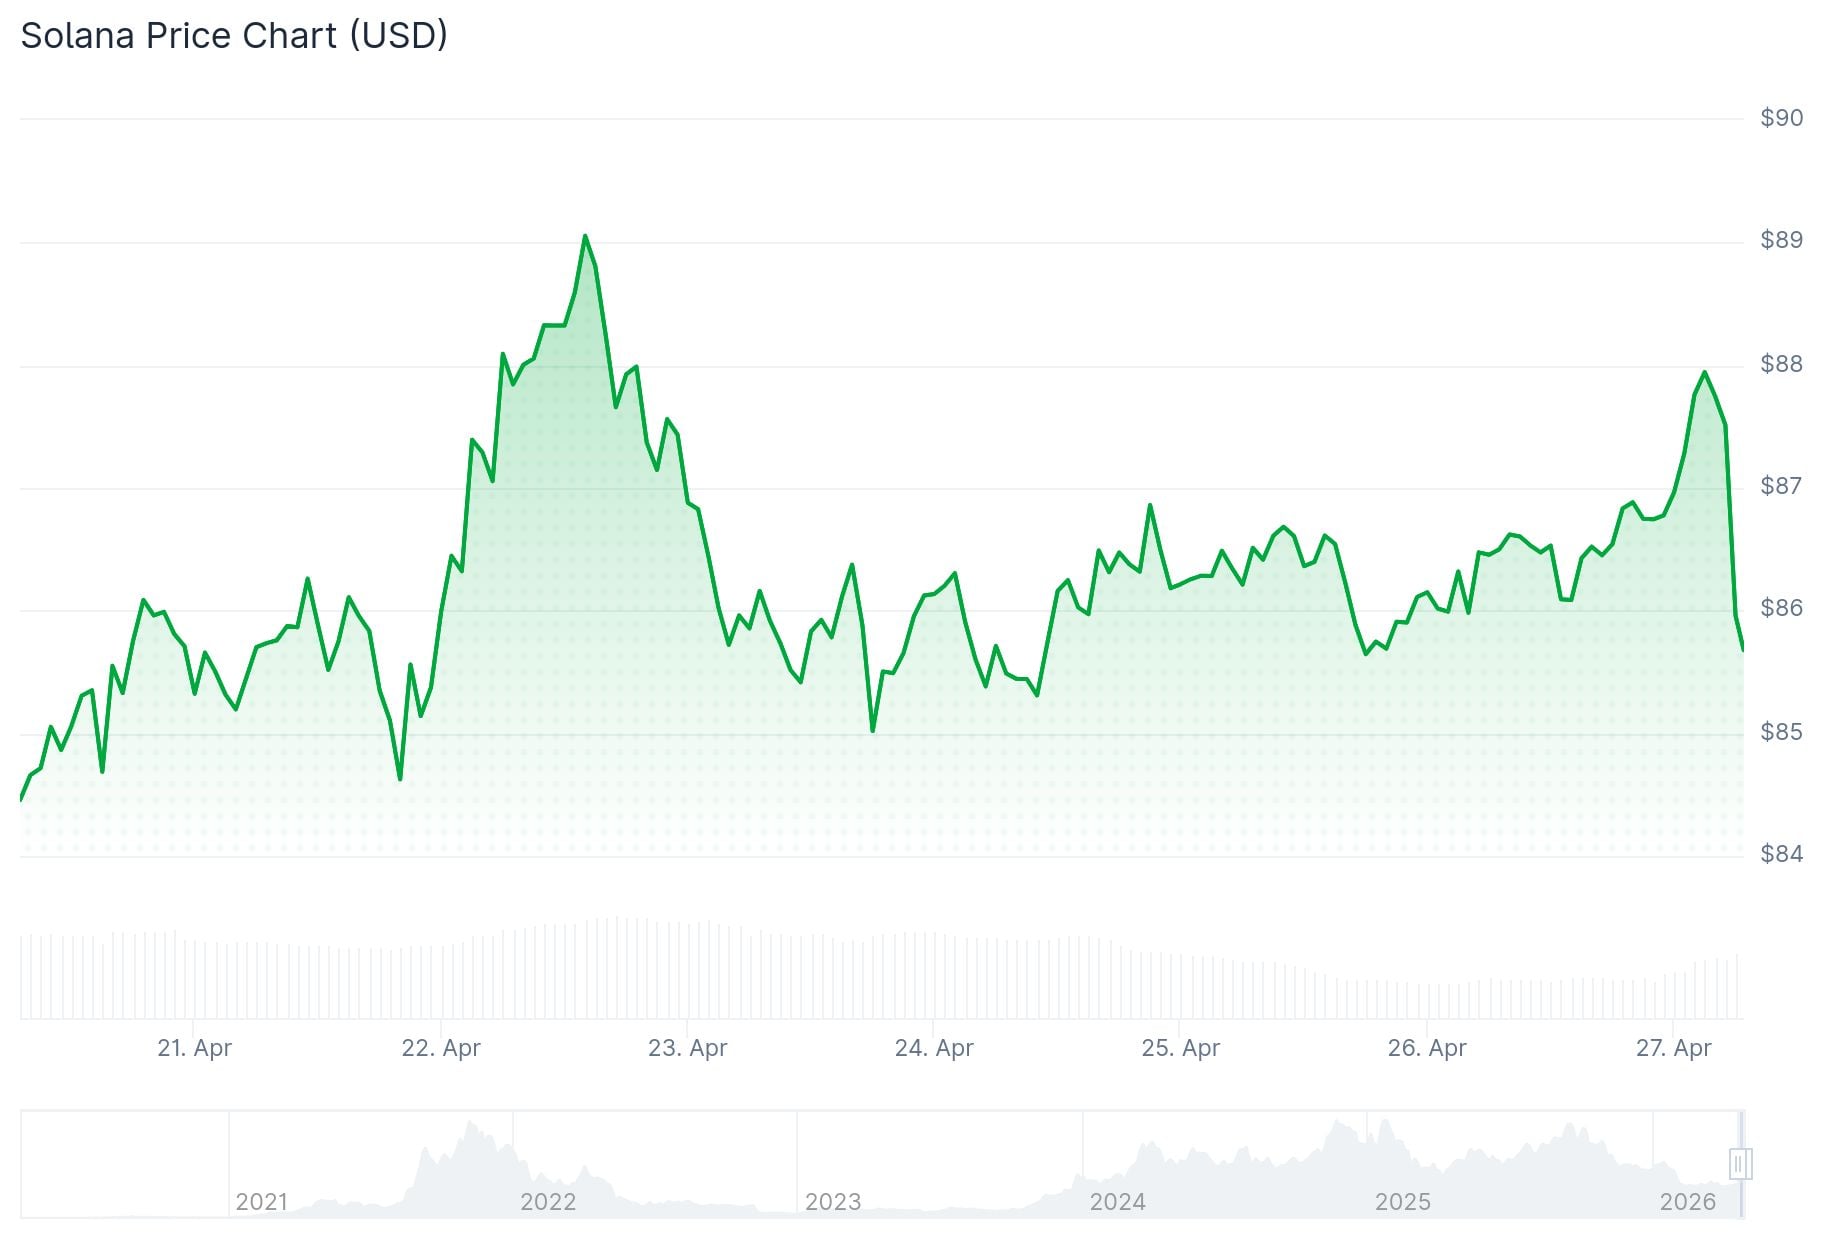 Solana (SOL) Price
SOL surpassed the 50% Fibonacci retracement level of the recent drop from $89.34 to $84.55. A bullish trend line is forming with support at $86.50 on the hourly chart.
The immediate resistance sits at $88.20, which aligns with the 76.4% Fibonacci level. The next major resistance is at $90, followed by $92.
Analyst Ali Martinez highlighted that SOL is trading inside a tight Bollinger Band range on the 3-day chart, between $77 and $94. He described this zone as a “no-trade zone,” warning that chasing moves within the range can lead to choppy losses. Martinez said a confirmed 3-day candle close outside the bands is needed before treating any move as a real breakout.
Volume has dropped more than 23% during this consolidation phase. Lower volume during sideways price action is common, but a breakout above $94 would need stronger participation to support a move toward $100.
Technical Indicators Turn Cautiously Positive
The Relative Strength Index (RSI) sits at 55, rising above the midline on the daily chart. The MACD and its signal line have moved into positive territory, suggesting buyers currently have the edge.
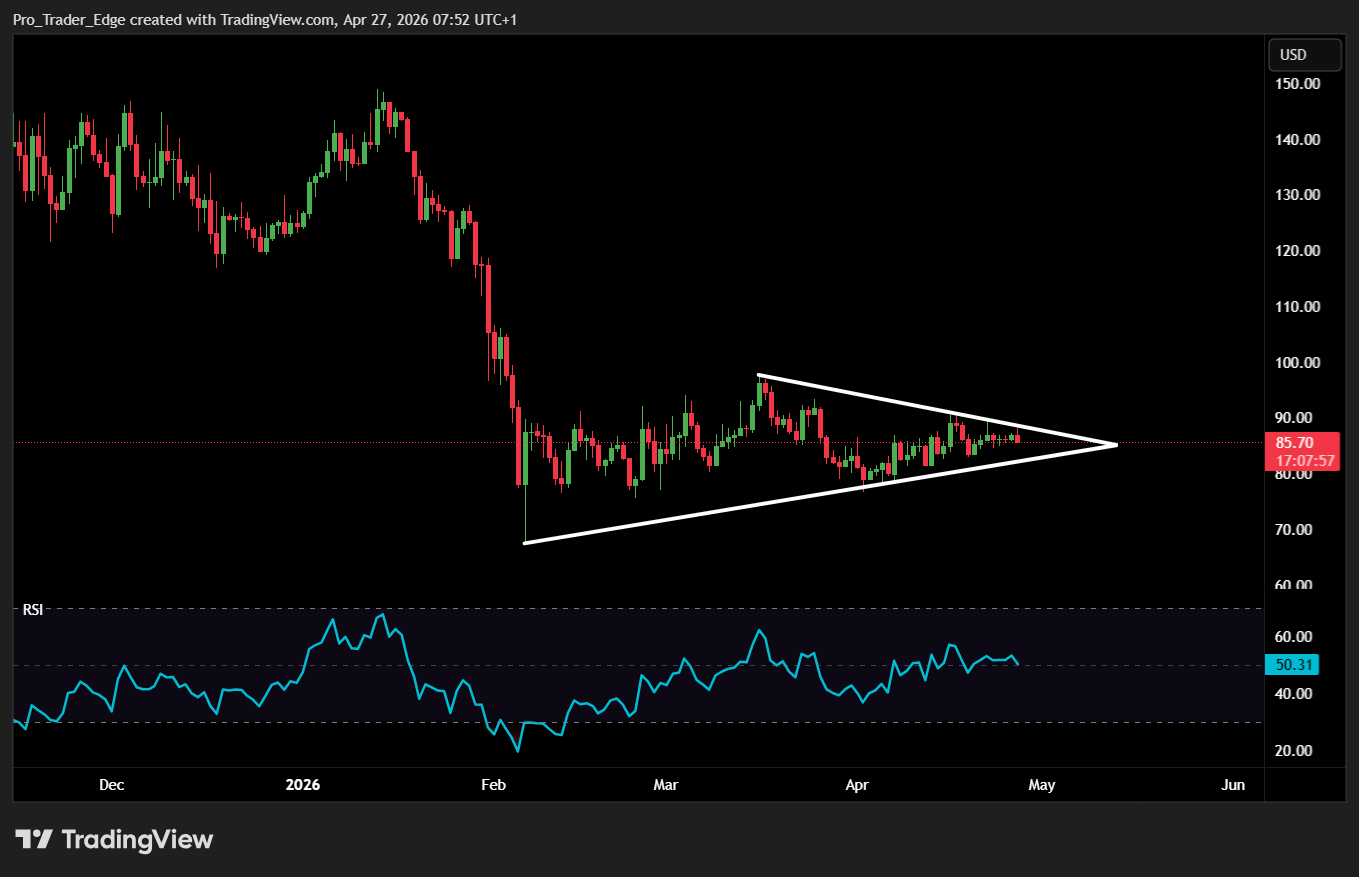 Source: TradingView
SOL is approaching the overhead resistance of a symmetrical triangle pattern near $89.00 on the daily chart. A sustained move above this level would expose the $100 psychological target, then the 200-day EMA at $113.
On the downside, the 50-day EMA at $87.04 is the first line of support. A daily close below the rising trendline near $85.99 would weaken the current structure.
ETF Inflows and Institutional Interest
SOL-focused ETFs recorded $9.44 million in net weekly inflows, following $35.17 million the prior week. Five consecutive days of net inflows have totaled approximately $1.45 billion.
Goldman Sachs disclosed a position of nearly $108 million in Solana, adding to the list of institutional data points traders are watching.
SOL futures Open Interest rose over 2% in 24 hours to $5.23 billion. The funding rate spiked to 0.0095%, indicating traders are paying a premium to hold long positions.
If SOL fails to break above $90–$94, initial downside support is at $86.50, then $85. A close below $78 could push price toward $72.
The post Solana (SOL) Price: SOL Eyes $100 Breakout — Here’s the Level Traders Are Watching appeared first on CoinCentral.


You May Also Like
![[Rappler’s Best] Second quarter storm](https://www.rappler.com/tachyon/2026/04/rapplers-best-second-quarter-storm-April-27-2026.jpg)
[Rappler’s Best] Second quarter storm

Trump's family creating problems for GOP as clock ticks down on president's promised bill


