Pepe Coin (PEPE) Price Prediction: Falling Wedge Breakout Signals Momentum Shift—Can Bulls Target $0.00000736 Next?
The latest Pepe price structure suggests that bulls are attempting to regain control after a confirmed breakout from a key technical pattern, placing the spotlight on whether momentum can sustain toward higher resistance zones.
Falling Wedge Breakout Signals Shift in Pepe Price Trend
Recent movements in the Pepe coin price chart indicate a confirmed breakout from a falling wedge formation, a pattern often associated with bullish reversals. The breakout above the descending trendline, combined with a reclaim of key exponential moving averages (EMA), signals a possible transition in trend.
 PEPEUSDT has broken out of a bullish falling wedge pattern and reclaimed key EMA levels, indicating a potential shift toward upward momentum. Source: coinpediamarkets on TradingView
Market observers note that “the breakout of the descending structure alongside EMA support is an early indication that downside momentum is weakening.” This shift is further supported by the formation of higher lows, suggesting that buyers are gradually stepping in at elevated levels.
At the time of writing, the Pepe crypto price is hovering near the $0.0000039 range, reflecting a relatively stable consolidation phase after the breakout. Immediate resistance is seen between $0.00000482 and $0.00000509, while a broader upside target lies near the $0.00000700–$0.00000736 zone. On the downside, structural support remains around $0.00000310.
Descending Channel Keeps Market at a Critical Decision Point
Despite the bullish wedge breakout, the broader Pepe coin chart still reflects a longer-term descending channel on higher timeframes. This pattern has been characterized by consistently lower highs and lower lows, indicating that the overall market structure has yet to fully reverse.
 On the 2D timeframe, PEPE/USDT remains within a descending channel marked by consistent lower highs and lower lows, with price nearing a critical resistance zone that could determine the next directional move. Source: CryptoNuclear on TradingView
Price is currently approaching the upper boundary of this channel, making it a decisive area for the next directional move. Analysts suggest that “a confirmed breakout above channel resistance, especially with strong volume and a close above $0.00000444, could validate a broader trend reversal.”
If such a breakout occurs, upside targets extend toward $0.00000500, $0.00000625, and potentially the $0.00000723 region, aligning closely with current Pepe price prediction models. However, failure to break resistance may lead to another rejection, with downside risks toward $0.00000300 or even $0.00000278.
Technical Indicators Show Neutral-to-Bullish Bias
From a broader technical standpoint, indicators present a mixed yet slightly constructive outlook for the Pepe token price. Oscillators such as the Relative Strength Index (RSI) remain in neutral territory around 57, indicating balanced momentum without overbought conditions.
 Pepe coin was trading at around $0.000003940, up 0.58% in the last 24 hours at press time. Source: Brave New Coin
Meanwhile, moving averages provide a more supportive backdrop. Short- to mid-term EMAs and SMAs continue to generate buy signals, suggesting underlying strength in the current trend. However, longer-term averages remain bearish, reflecting lingering pressure from previous market cycles.
This combination points to a market in transition. As one summary highlights, “short-term momentum is improving, but confirmation of a sustained trend reversal is still required.”
Key Levels to Watch for Pepe Price Prediction
For traders tracking the Pepe coin price prediction today, several key levels remain critical:
- Immediate resistance: $0.00000482 – $0.00000509
- Major resistance: $0.00000700 – $0.00000736
- Key support: $0.00000310
- Channel resistance: Breakout confirmation zone
- Channel support: Downside risk area
 PEPE is consolidating within a symmetrical triangle on the daily chart, with a volume-supported breakout potentially driving the price toward $0.000026. Source: @WHALES_CRYPTOt via X
A sustained move above resistance, combined with a successful retest, would strengthen the bullish case. Conversely, failure to hold above the breakout zone could invalidate the current setup and trigger renewed downside pressure.
Outlook: Can Pepe Coin Sustain the Breakout?
The current Pepe coin news landscape reflects cautious optimism. While the falling wedge breakout and improving short-term indicators point to strengthening momentum, the presence of a broader descending channel and mixed long-term signals calls for measured expectations.
 Pepe coin price shows a clear transition after a sharp market flush, with momentum stabilizing since February 2026 as the asset holds above prior lows. Source: MasterAnanda on TradingView
In the near term, the ability of the Pepe coin price to hold above its breakout structure will be critical. A confirmed push toward the $0.00000736 level would mark a significant shift in trend and reinforce bullish sentiment.
However, as with any Pepe crypto price prediction, market conditions remain dynamic. Traders are likely to watch for confirmation signals, including volume expansion, higher highs, and sustained support levels, before positioning for a larger move.


You May Also Like

Heavy Mayon ashfall affects thousands in Albay
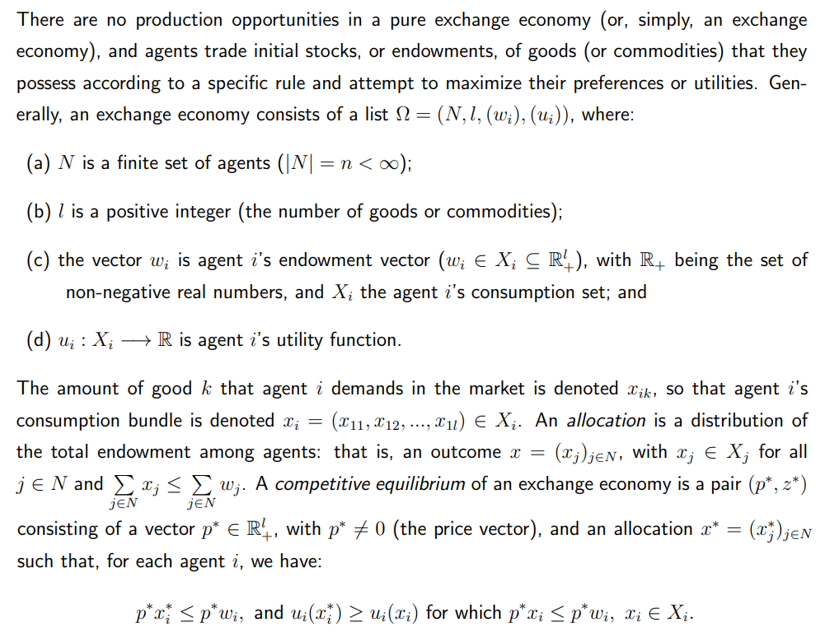
Game Theory and Exchange Economies: A New Model for Pure Exchange and Transferable Payoff