The post Zcash Price Analysis: ZEC Rally Faces Its First Test After Fee Proposal Surge—Will it Reach $500? appeared first on Coinpedia Fintech News Zcash price has been one of the most followed tokens after it rebounded from its lows close to $300. The rally was followed by Shielded Labs’ dynamic fee proposal, which has shifted the narrative to a critical post-news phase. Currently, the market participants are looking into whether the ZEC price can hold gains or fade …The post Zcash Price Analysis: ZEC Rally Faces Its First Test After Fee Proposal Surge—Will it Reach $500? appeared first on Coinpedia Fintech News Zcash price has been one of the most followed tokens after it rebounded from its lows close to $300. The rally was followed by Shielded Labs’ dynamic fee proposal, which has shifted the narrative to a critical post-news phase. Currently, the market participants are looking into whether the ZEC price can hold gains or fade …

Zcash Price Analysis: ZEC Rally Faces Its First Test After Fee Proposal Surge—Will it Reach $500?

2025/12/10 18:38
Zcash Price Prediction 2025

The post Zcash Price Analysis: ZEC Rally Faces Its First Test After Fee Proposal Surge—Will it Reach $500? appeared first on Coinpedia Fintech News

Zcash price has been one of the most followed tokens after it rebounded from its lows close to $300. The rally was followed by Shielded Labs’ dynamic fee proposal, which has shifted the narrative to a critical post-news phase. Currently, the market participants are looking into whether the ZEC price can hold gains or fade once the reaction cools. 

ZEC surged nearly 12% after the proposal, briefly reclaiming levels lost during November’s correction. But with the announcement now widely digested, price action is increasingly being driven by positioning, liquidity, and technical confirmation rather than fresh catalysts.

Key Levels Traders Watching Now

The market has largely absorbed the initial optimism around the proposed dynamic fee system. This aims to reduce transaction costs and ease congestion. While the proposal is viewed positively, it remains unimplemented, meaning no immediate on-chain changes have occurred.

As a result, traders have begun rotating focus away from the headline itself and toward whether demand can sustain prices above recently reclaimed levels.

zcash price

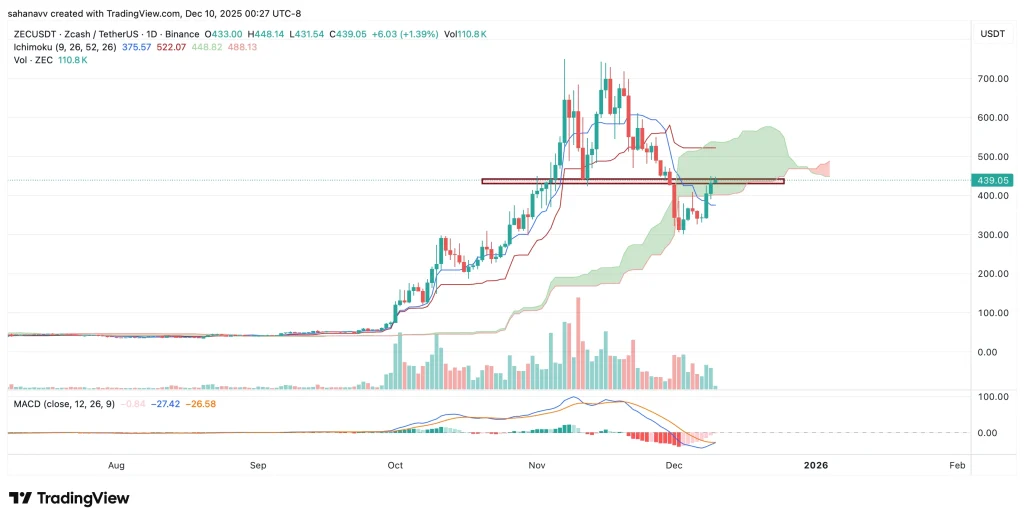
After bouncing from the $330 support zone, the ZEC price has entered a high-risk consolidation range between $435 and $442 — an area associated with prior distribution and short-term liquidation clusters.

  • Above $450: Opens upside toward $480, where prior supply remains heavy
  • Below $430: Increases risk of long liquidation cascades, with downside toward $400–$380
  • Invalidation zone: Sustained loss of $400 would weaken the post-news bullish setup

Until one of these levels breaks decisively, ZEC remains range-bound despite the recent surge. Momentum indicators show stabilization rather than acceleration. Selling pressure has eased, but follow-through remains limited—a common pattern after event-driven moves in low-to-mid liquidity assets like ZEC. Volume has cooled since the post-announcement spike, suggesting traders are waiting for confirmation rather than chasing price. This environment tends to favor mean reversion rather than aggressive trend continuation unless a clear breakout emerges.

Can ZEC Reach $500 Before the End of 2025?

A move to $500 is possible for the Zcash (ZEC) price before the end of 2025, largely dependent on post-news follow-through. The recent rally driven by the dynamic fee proposal has already been priced in, shifting the focus to whether buyers can sustain momentum above key resistance levels. A confirmed breakout above $450, followed by strong volume and broader strength in the privacy coin sector, would be required to open a realistic path toward $500. 

Disclaimer: The articles reposted on this site are sourced from public platforms and are provided for informational purposes only. They do not necessarily reflect the views of MEXC. All rights remain with the original authors. If you believe any content infringes on third-party rights, please contact service@support.mexc.com for removal. MEXC makes no guarantees regarding the accuracy, completeness, or timeliness of the content and is not responsible for any actions taken based on the information provided. The content does not constitute financial, legal, or other professional advice, nor should it be considered a recommendation or endorsement by MEXC.

You May Also Like

Edges higher ahead of BoC-Fed policy outcome

Edges higher ahead of BoC-Fed policy outcome

The post Edges higher ahead of BoC-Fed policy outcome appeared on BitcoinEthereumNews.com. USD/CAD gains marginally to near 1.3760 ahead of monetary policy announcements by the Fed and the BoC. Both the Fed and the BoC are expected to lower interest rates. USD/CAD forms a Head and Shoulder chart pattern. The USD/CAD pair ticks up to near 1.3760 during the late European session on Wednesday. The Loonie pair gains marginally ahead of monetary policy outcomes by the Bank of Canada (BoC) and the Federal Reserve (Fed) during New York trading hours. Both the BoC and the Fed are expected to cut interest rates amid mounting labor market conditions in their respective economies. Inflationary pressures in the Canadian economy have cooled down, emerging as another reason behind the BoC’s dovish expectations. However, the Fed is expected to start the monetary-easing campaign despite the United States (US) inflation remaining higher. Investors will closely monitor press conferences from both Fed Chair Jerome Powell and BoC Governor Tiff Macklem to get cues about whether there will be more interest rate cuts in the remainder of the year. According to analysts from Barclays, the Fed’s latest median projections for interest rates are likely to call for three interest rate cuts by 2025. Ahead of the Fed’s monetary policy, the US Dollar Index (DXY), which tracks the Greenback’s value against six major currencies, holds onto Tuesday’s losses near 96.60. USD/CAD forms a Head and Shoulder chart pattern, which indicates a bearish reversal. The neckline of the above-mentioned chart pattern is plotted near 1.3715. The near-term trend of the pair remains bearish as it stays below the 20-day Exponential Moving Average (EMA), which trades around 1.3800. The 14-day Relative Strength Index (RSI) slides to near 40.00. A fresh bearish momentum would emerge if the RSI falls below that level. Going forward, the asset could slide towards the round level of…
Share
BitcoinEthereumNews2025/09/18 01:23