

Ethereum (ETH) Price Ready for 9-16% Move amid Bullish Divergence, Buy the Dips?
Ethereum ETH $3 207 24h volatility: 3.5% Market cap: $387.13 B Vol. 24h: $36.14 B price is down 3.5% on Dec. 11, slipping under $3,200, amid the broader crypto market sell-off after the Fed rate cut announcement. Market experts believe that ETH charts show the possibility of a 9-16% move ahead, along with the formation of a bullish divergence pattern. On the other hand, flows into spot Ether ETFs continue to remain in the positive territory.
Ethereum Price Volatility Likely Ahead
Citing his proprietary Divergence Superstack, crypto analyst Ardi noted that the chart flashes a strong “Bullish Divergence” for Ethereum price. He added that such a signal has appeared for the first time in a month.
According to the algorithm, the setup has a strength score of 7.61, suggesting a historically meaningful reversal zone. Ardi noted that the last three times this signal alert came, the ETH price moved 9-16%. However, these swings have been in both directions, up and down.
On Sept. 20, Ethereum price moved from $4,540 to $3,800. While on Oct 1, it moved from $4,000 to $4,770. The last time the bullish divergence appeared on November 6, ETH price moved from $3,450 to $3,140.
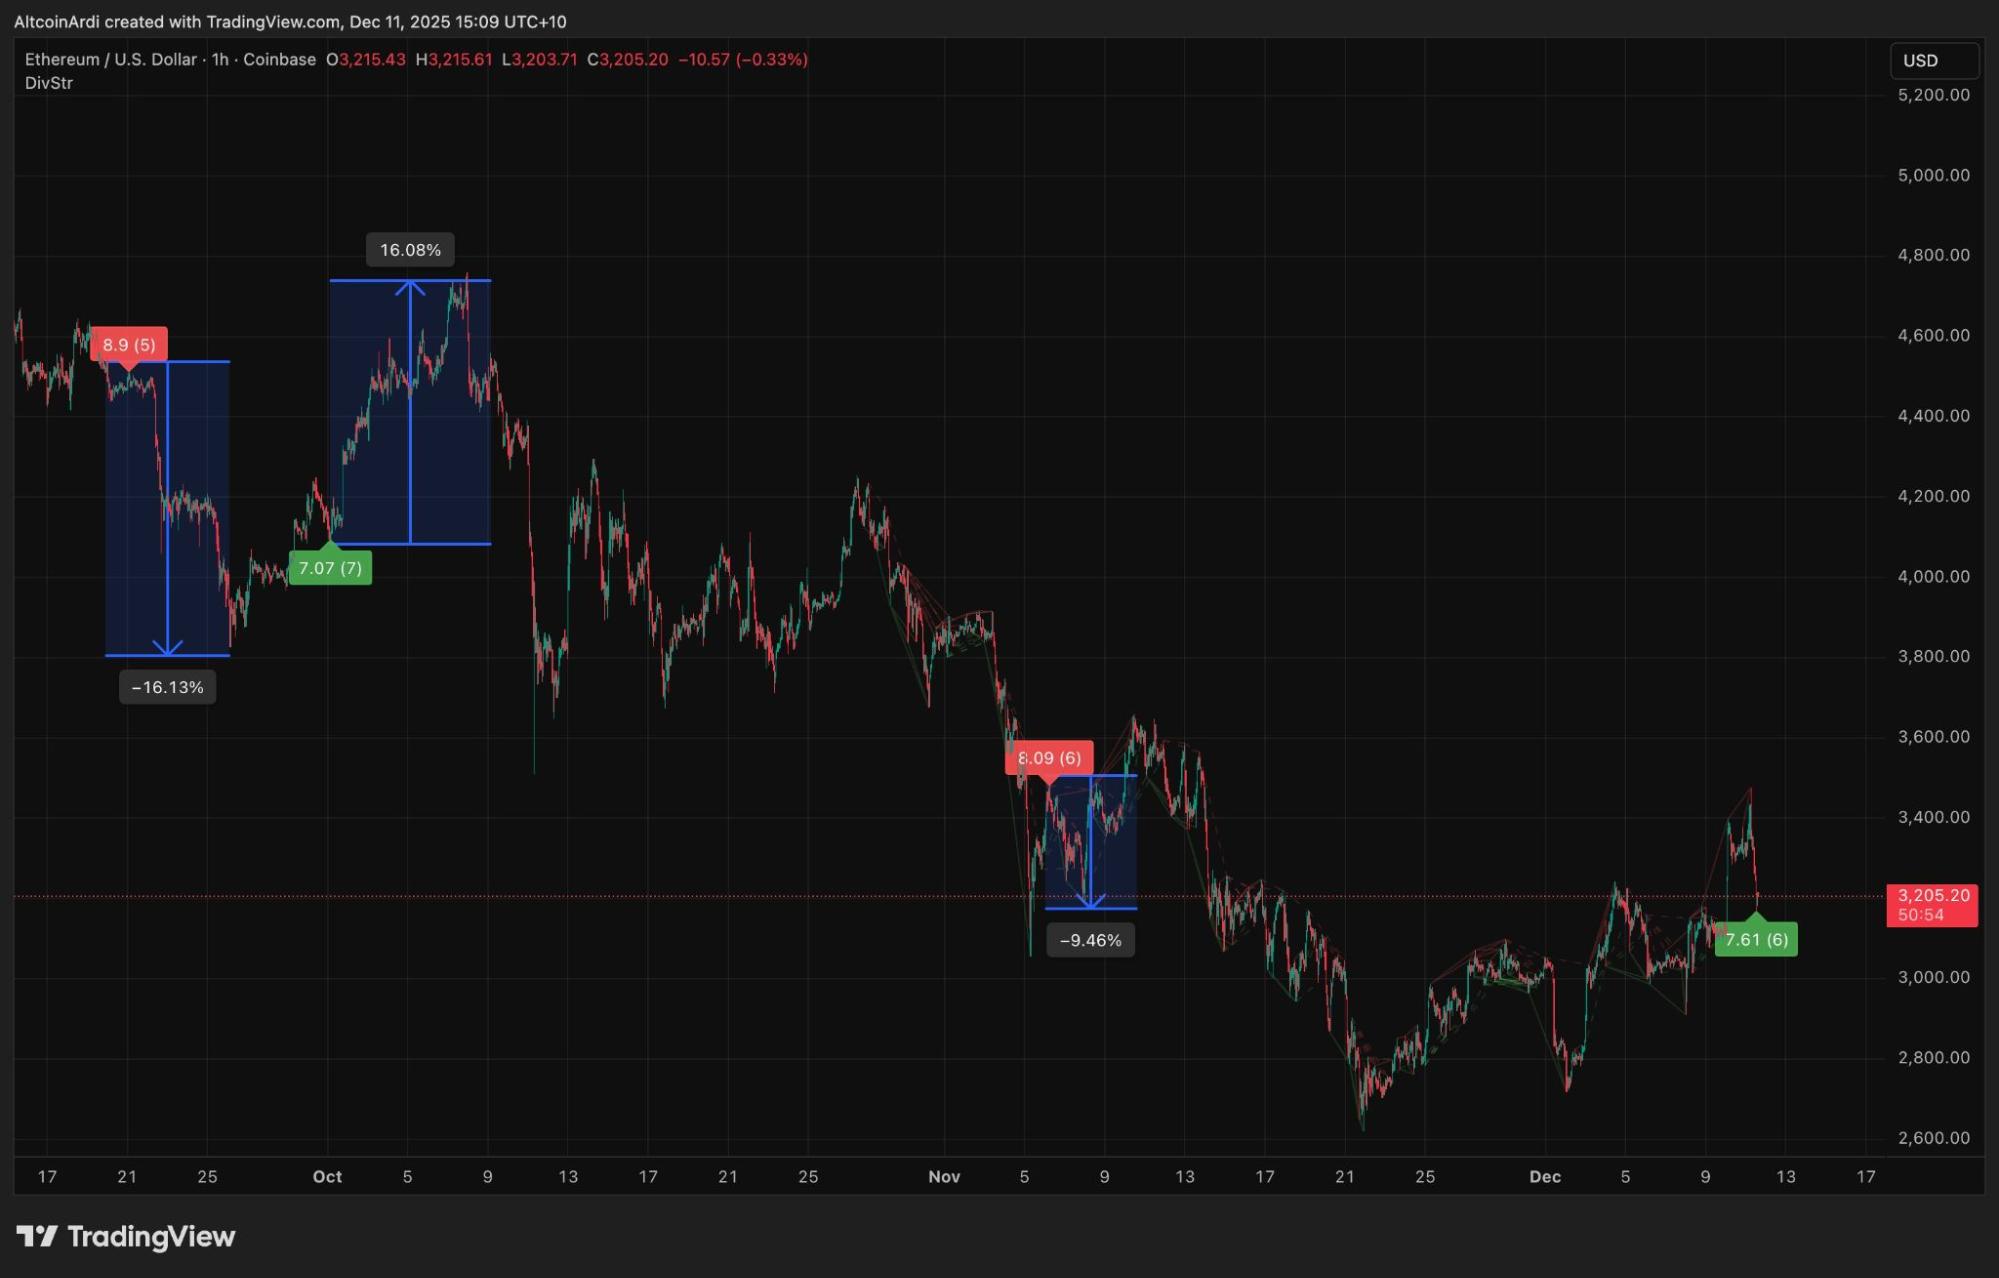
Ethereum price bullish divergence signal | Source: Ardi
Citing this indicator, Ardi also wrote:
Whales and Institutions Continue Buying
Amid the current Ethereum price movement, a BitcoinOG whale has doubled down on his ETH long positions. The whale, identified as “1011short,” has increased its ETH long position to 120,094 ETH, worth a massive $392.5 million.
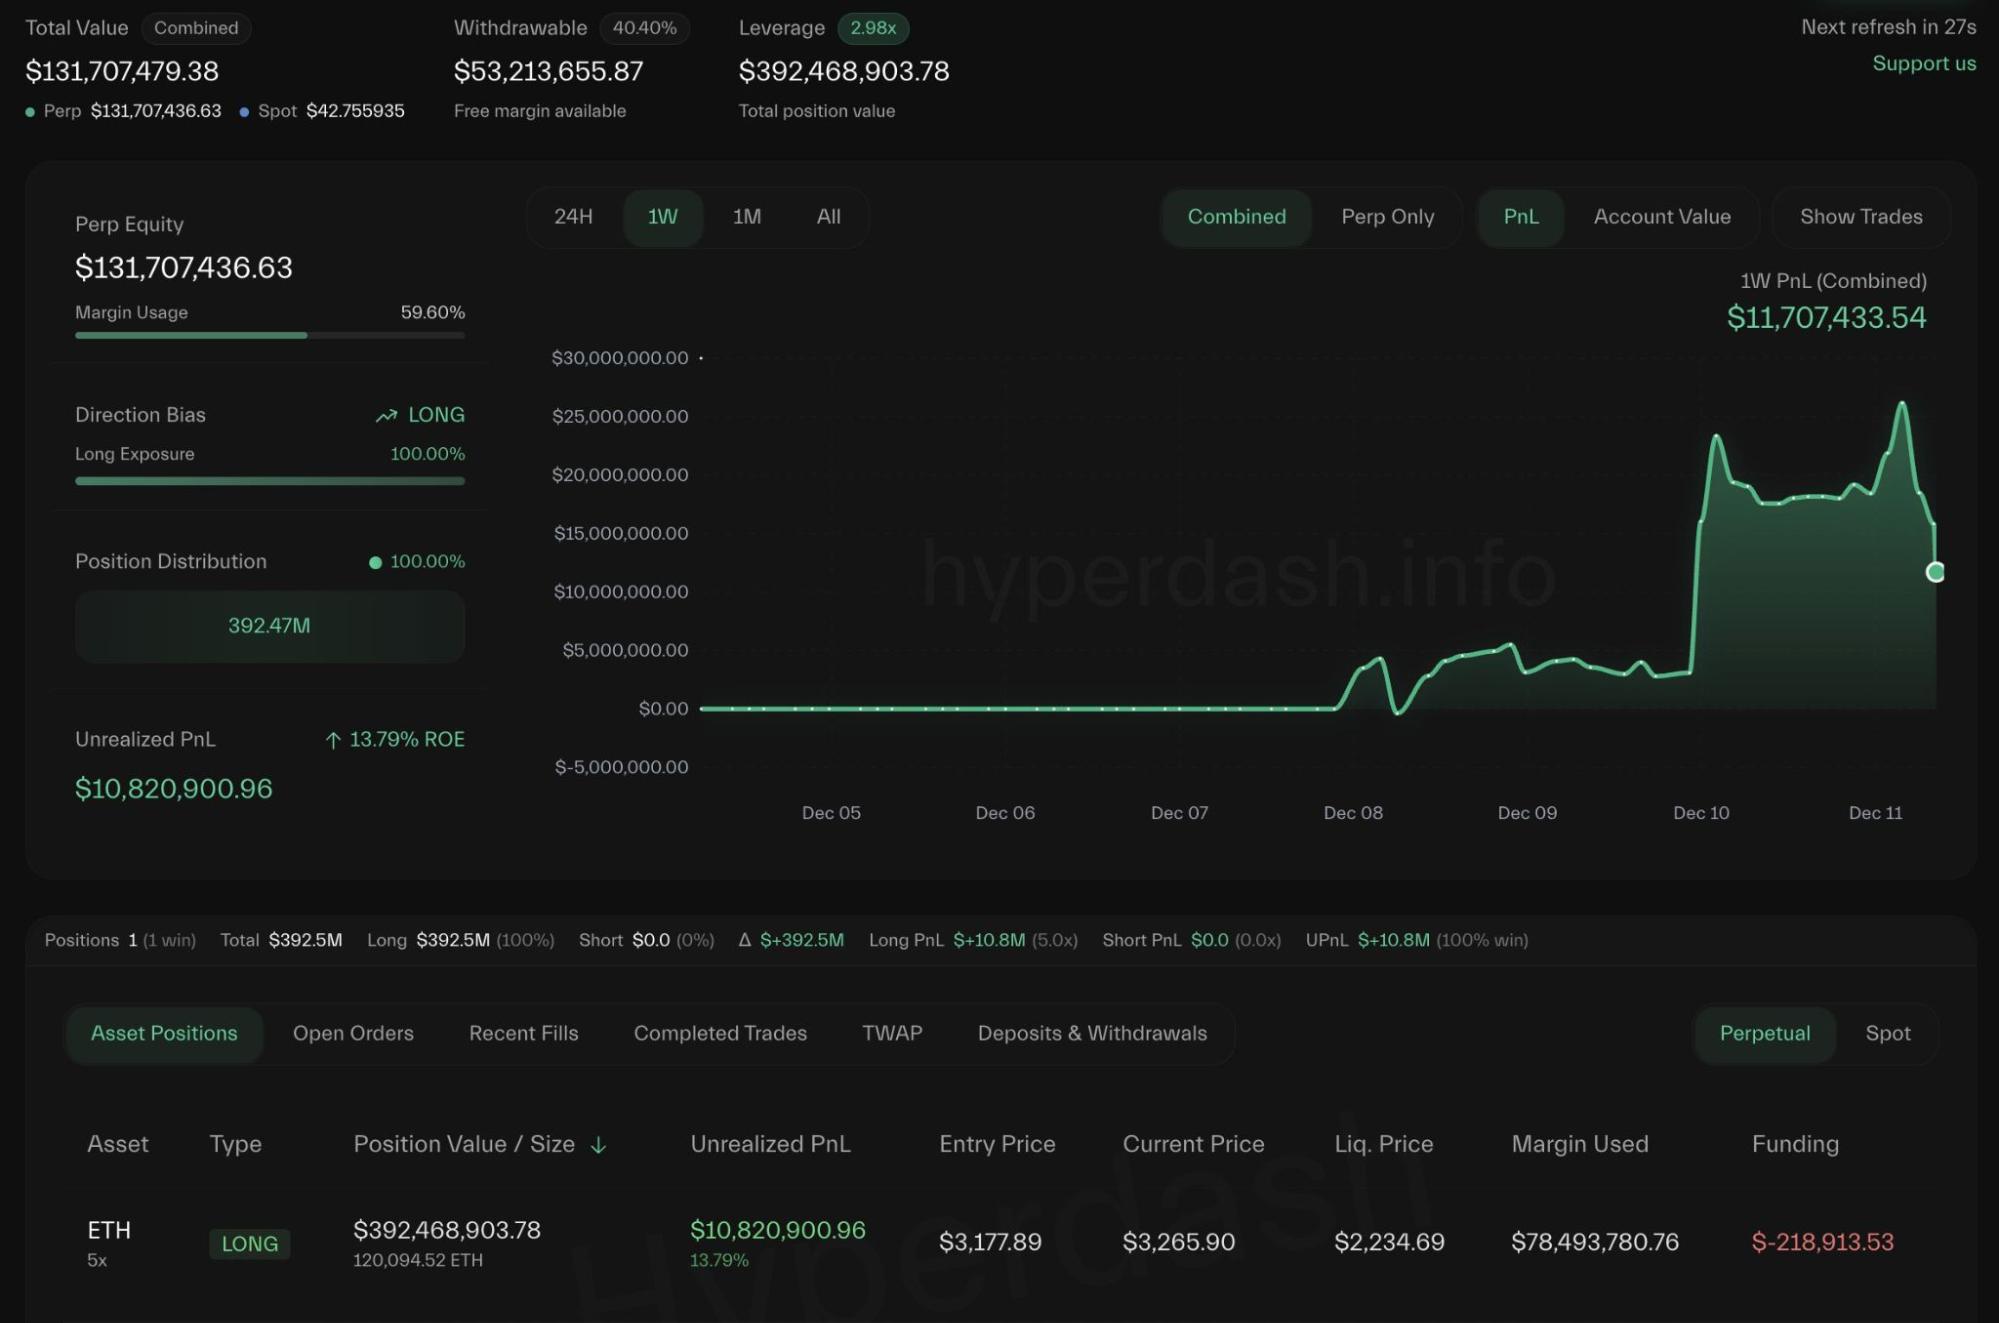
Whale increases ETH long position | Source: Hyperdash
The position carries a liquidation price of $2,234.69. It shows that there’s a substantial high leverage, and a strong conviction for further Ethereum upside.
On the other hand, Tom Lee’s BitMine Technologies (BMNR) has continued with its aggressive ETH purchases. A few hours back, the firm purchased an additional 33,504 ETH worth $112 million. The firm already has 3.9 million ETH holdings, and is on a path to achieving its 5% of ETH supply holdings.
On the other hand, inflows into spot Ethereum ETFs have remained strong this week. According to data from Farside Investors, total inflows so far this week have already crossed $250 million.
nextThe post Ethereum (ETH) Price Ready for 9-16% Move amid Bullish Divergence, Buy the Dips? appeared first on Coinspeaker.
You May Also Like

Worldcoin Price Prediction 2025-2030: Will WLD Skyrocket to $10?

Top Altcoins To Hold Before 2026 For Maximum ROI – One Is Under $1!
