TLDR Ethereum price defends key $2,800–$2,845 support after sharp correction Liquidation flush reduces leverage, signaling a sentiment reset Falling wedge patternTLDR Ethereum price defends key $2,800–$2,845 support after sharp correction Liquidation flush reduces leverage, signaling a sentiment reset Falling wedge pattern

Ethereum(ETH) Price Prediction: Falling Wedge Signals $4.4K Breakout

TLDR

  • Ethereum price defends key $2,800–$2,845 support after sharp correction
  • Liquidation flush reduces leverage, signaling a sentiment reset
  • Falling wedge pattern suggests weakening bearish momentum
  • Breakout above resistance could open a move toward the $4.4K target

Ethereum price is navigating a critical consolidation phase after an extended correction from its mid-2025 peak. Recent technical structures, liquidation data, and chart patterns suggest downside pressure is easing near key support. Analysts are now assessing whether Ethereum price can stabilize and set up a recovery toward higher resistance zones, with $4,400 emerging as a longer-term technical objective.

Ethereum Price Holds Critical $2,800 Support Zone

According to analyst Ted, the daily ETH chart shows Ethereum price consolidating after a sharp decline from highs above $4,800. Price is currently range-bound, with strong buyer defense visible around the $2,800–$2,845 support zone. This area aligns with prior swing lows and historical high-volume accumulation levels, reinforcing its technical importance.Image

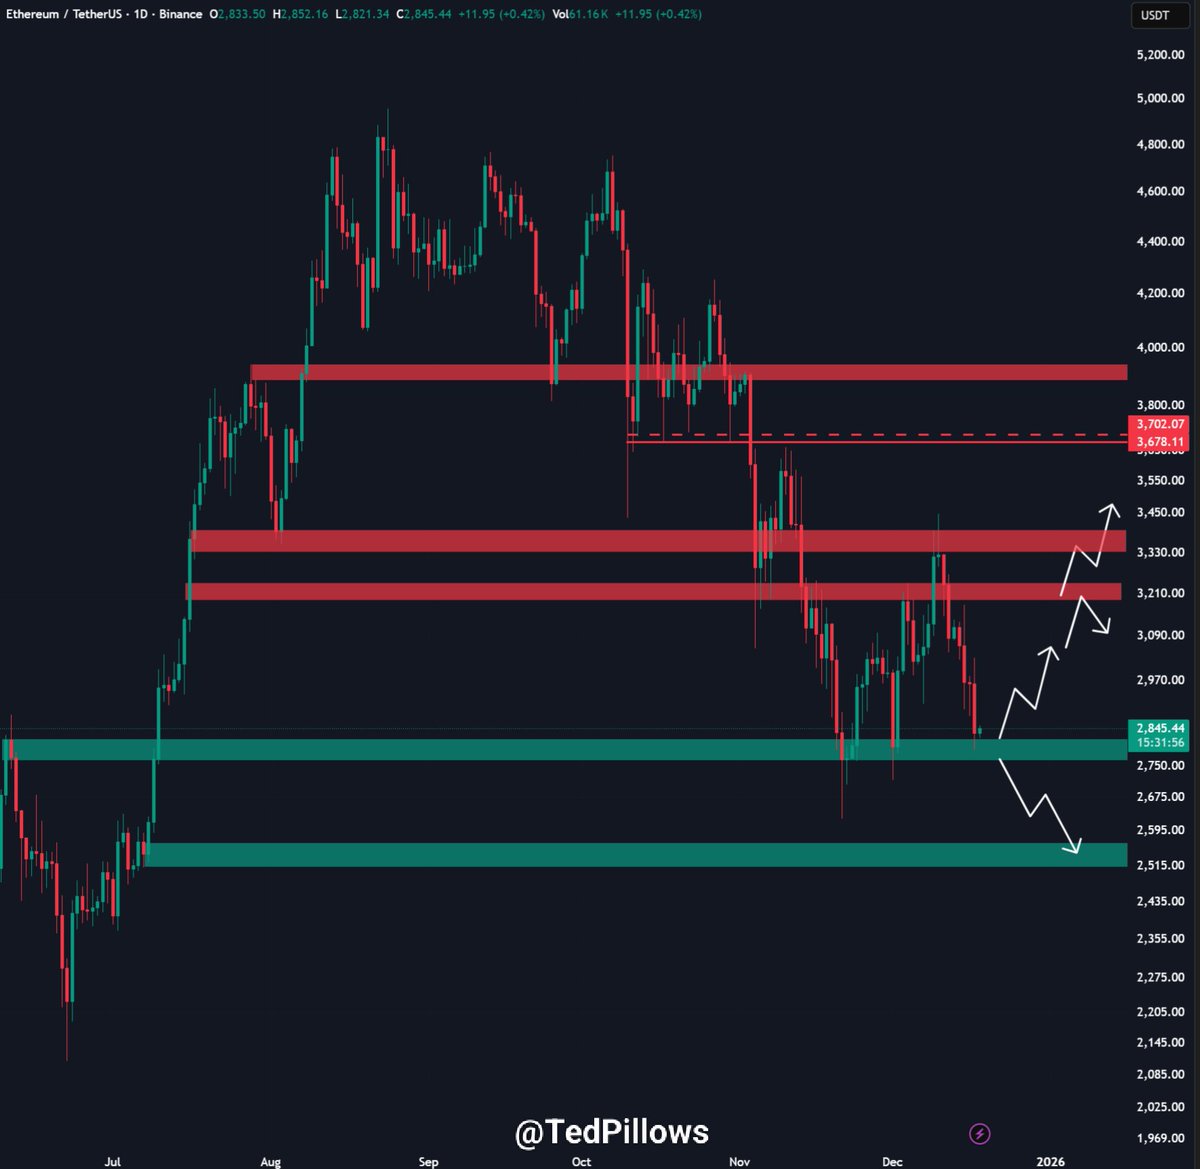
Recent candles show higher lows forming within this support band following a brief downside wick, while sell volume has gradually declined. This behavior suggests demand is absorbing supply rather than aggressive distribution taking place. As long as Ethereum price remains above this zone, the broader higher-timeframe structure retains a constructive bias.

Overhead, resistance remains clearly defined between $3,300 and $3,700, with an additional barrier near $4,000. Ted notes that a decisive daily close above $2,950 would be an early signal of renewed upside momentum. Conversely, a failure to hold $2,800 could expose Ethereum price to a deeper retracement toward the $2,500 region.

Liquidation Data Signals Sentiment Reset After Sell-Off

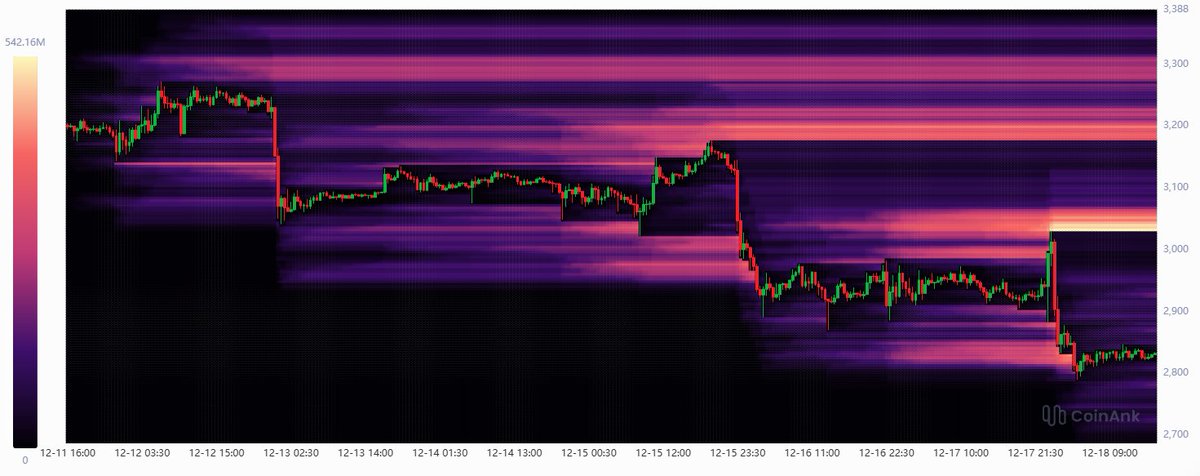
Meanwhile, liquidation data shared by analyst CW highlights a significant shift in Ethereum’s derivatives landscape. The liquidation heatmap shows heavy clusters of long liquidations between $3,300 and $3,400 during the December sell-off. These cascading events accelerated downside moves and cleared a large portion of leveraged positions from the market.Image

SOURCE: X

At current levels, liquidation intensity has faded notably. This reduction suggests leverage has been flushed, often a sign of sentiment reset following corrective phases. Historically, such conditions reduce forced selling risk and can precede periods of price stabilization or recovery, particularly when aligned with strong technical support.

CW noted that while some liquidation clusters remain below $2,700, the bulk of overextended long exposure has already been removed. This creates a cleaner technical environment, where price movements are more likely to reflect spot demand rather than liquidation-driven volatility. As a result, Ethereum price may now be better positioned to respond to broader market cues.

Wedge Pattern Points to ETH Price Upside Expansion

In addition, analyst Don highlights a developing falling wedge pattern on the 3-hour ETH/USDT chart. This structure has been forming since September 2025, marked by lower highs and lower lows with contracting volume. Such formations often signal weakening bearish momentum as price approaches the wedge apex.

Ethereum price continues to respect wedge support around the $2,600–$2,700 region, while repeated rejections near $2,900 define the upper boundary. The compression suggests an imminent resolution, with early bullish divergence appearing on lower-timeframe momentum indicators. These signals indicate sellers may be losing control.Image

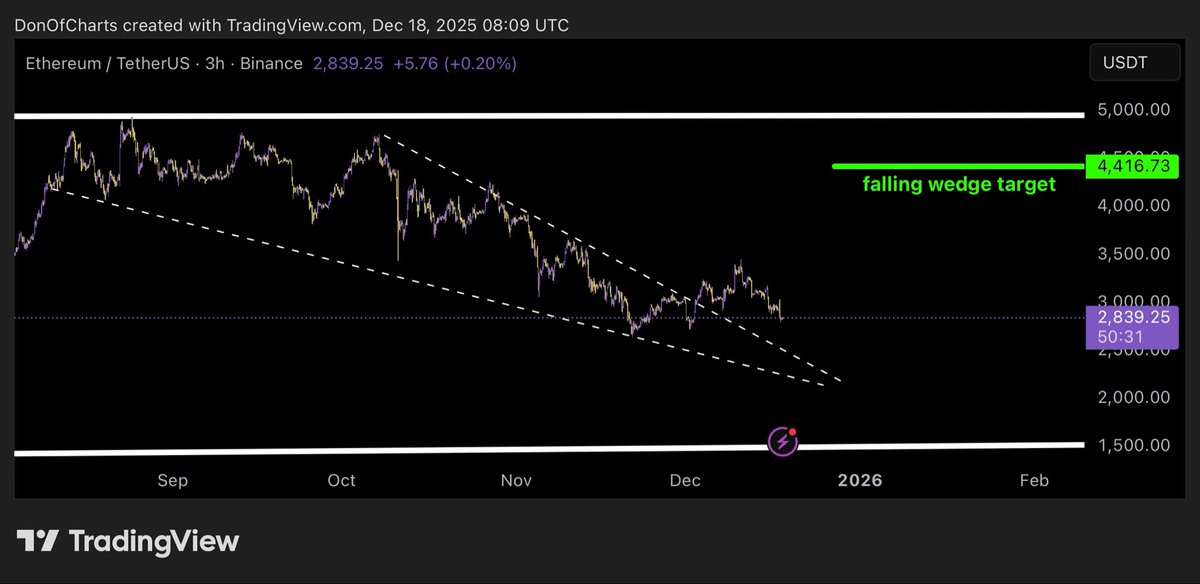
According to Don, a confirmed breakout above the wedge’s upper trendline could trigger a rapid upside move. The measured projection from this pattern targets approximately $4,416, aligning with prior resistance zones highlighted on higher timeframes. Invalidation remains below wedge support, but the pattern’s historical reliability favors an upside resolution.

Ethereum price remains at a technically sensitive juncture, where strong support, reduced leverage, and compression patterns converge. Confirmation will depend on sustained strength above near-term resistance, as traders continue to monitor volatility expansion signals closely.

The post Ethereum(ETH) Price Prediction: Falling Wedge Signals $4.4K Breakout appeared first on CoinCentral.

Market Opportunity
Ethereum Logo
Ethereum Price(ETH)
$2,955.79
$2,955.79$2,955.79
-0.35%
USD
Ethereum (ETH) Live Price Chart
Disclaimer: The articles reposted on this site are sourced from public platforms and are provided for informational purposes only. They do not necessarily reflect the views of MEXC. All rights remain with the original authors. If you believe any content infringes on third-party rights, please contact service@support.mexc.com for removal. MEXC makes no guarantees regarding the accuracy, completeness, or timeliness of the content and is not responsible for any actions taken based on the information provided. The content does not constitute financial, legal, or other professional advice, nor should it be considered a recommendation or endorsement by MEXC.

You May Also Like

Egrag Crypto: XRP Could be Around $6 or $7 by Mid-November Based on this Analysis

Egrag Crypto: XRP Could be Around $6 or $7 by Mid-November Based on this Analysis

Egrag Crypto forecasts XRP reaching $6 to $7 by November. Fractal pattern analysis suggests a significant XRP price surge soon. XRP poised for potential growth based on historical price patterns. The cryptocurrency community is abuzz after renowned analyst Egrag Crypto shared an analysis suggesting that XRP could reach $6 to $7 by mid-November. This prediction is based on the study of a fractal pattern observed in XRP’s past price movements, which the analyst believes is likely to repeat itself in the coming months. According to Egrag Crypto, the analysis hinges on fractal patterns, which are used in technical analysis to identify recurring market behavior. Using the past price charts of XRP, the expert has found a certain fractal that looks similar to the existing market structure. The trend indicates that XRP will soon experience a great increase in price, and the asset will probably reach the $6 or $7 range in mid-November. The chart shared by Egrag Crypto points to a rising trend line with several Fibonacci levels pointing to key support and resistance zones. This technical structure, along with the fractal pattern, is the foundation of the price forecast. As XRP continues to follow the predicted trajectory, the analyst sees a strong possibility of it reaching new highs, especially if the fractal behaves as expected. Also Read: Why XRP Price Remains Stagnant Despite Fed Rate Cut #XRP – A Potential Similar Set-Up! I've been analyzing the yellow fractal from a previous setup and trying to fit it into various formations. Based on the fractal formation analysis, it suggests that by mid-November, #XRP could be around $6 to $7! Fractals can indeed be… pic.twitter.com/HmIlK77Lrr — EGRAG CRYPTO (@egragcrypto) September 18, 2025 Fractal Analysis: The Key to XRP’s Potential Surge Fractals are a popular tool for market analysis, as they can reveal trends and potential price movements by identifying patterns in historical data. Egrag Crypto’s focus on a yellow fractal pattern in XRP’s price charts is central to the current forecast. Having contrasted the market scenario at the current period and how it was at an earlier time, the analyst has indicated that XRP might revert to the same price scenario that occurred at a later cycle in the past. Egrag Crypto’s forecast of $6 to $7 is based not just on the fractal pattern but also on broader market trends and technical indicators. The Fibonacci retracements and extensions will also give more insight into the price levels that are likely to be experienced in the coming few weeks. With mid-November in sight, XRP investors and traders will be keeping a close eye on the market to see if Egrag Crypto’s analysis is true. If the price targets are reached, XRP could experience one of its most significant rallies in recent history. Also Read: Top Investor Issues Advance Warning to XRP Holders – Beware of this Risk The post Egrag Crypto: XRP Could be Around $6 or $7 by Mid-November Based on this Analysis appeared first on 36Crypto.
Share
Coinstats2025/09/18 18:36
DOGE ETF Hype Fades as Whales Sell and Traders Await Decline

DOGE ETF Hype Fades as Whales Sell and Traders Await Decline

The post DOGE ETF Hype Fades as Whales Sell and Traders Await Decline appeared on BitcoinEthereumNews.com. Leading meme coin Dogecoin (DOGE) has struggled to gain momentum despite excitement surrounding the anticipated launch of a US-listed Dogecoin ETF this week. On-chain data reveals a decline in whale participation and a general uptick in coin selloffs across exchanges, hinting at the possibility of a deeper price pullback in the coming days. Sponsored Sponsored DOGE Faces Decline as Whales Hold Back, Traders Sell The market is anticipating the launch of Rex-Osprey’s Dogecoin ETF (DOJE) tomorrow, which is expected to give traditional investors direct exposure to Dogecoin’s price movements.  However, DOGE’s price performance has remained muted ahead of the milestone, signaling a lack of enthusiasm from traders. According to on-chain analytics platform Nansen, whale accumulation has slowed notably over the past week. Large investors, with wallets containing DOGE coins worth more than $1 million, appear unconvinced by the ETF narrative and have reduced their holdings by over 4% in the past week.  For token TA and market updates: Want more token insights like this? Sign up for Editor Harsh Notariya’s Daily Crypto Newsletter here. Dogecoin Whale Activity. Source: Nansen When large holders reduce their accumulation, it signals a bearish shift in market sentiment. This reduced DOGE demand from significant players can lead to decreased buying pressure, potentially resulting in price stagnation or declines in the near term. Sponsored Sponsored Furthermore, DOGE’s exchange reserve has risen steadily in the past week, suggesting that more traders are transferring DOGE to exchanges with the intent to sell. As of this writing, the altcoin’s exchange balance sits at 28 billion DOGE, climbing by 12% in the past seven days. DOGE Balance on Exchanges. Source: Glassnode A rising exchange balance indicates that holders are moving their assets to trading platforms to sell rather than to hold. This influx of coins onto exchanges increases the available supply in…
Share
BitcoinEthereumNews2025/09/18 05:07
The Digital WOW Explains How AI Is Affecting Digital Marketing

The Digital WOW Explains How AI Is Affecting Digital Marketing

WEST PALM BEACH, Fla., Dec. 19, 2025 /PRNewswire/ — The Digital WOW, powered by ConsultPR.net, announces new findings on how AI is affecting digital marketing.
Share
AI Journal2025/12/19 17:30