

Solana Price Today (SOL/USDT): Weak Rebound but Bearish Outlook

In the current context, the Solana price today on the SOLUSDT pair remains within a weak underlying framework, despite a short-term stabilization attempt.
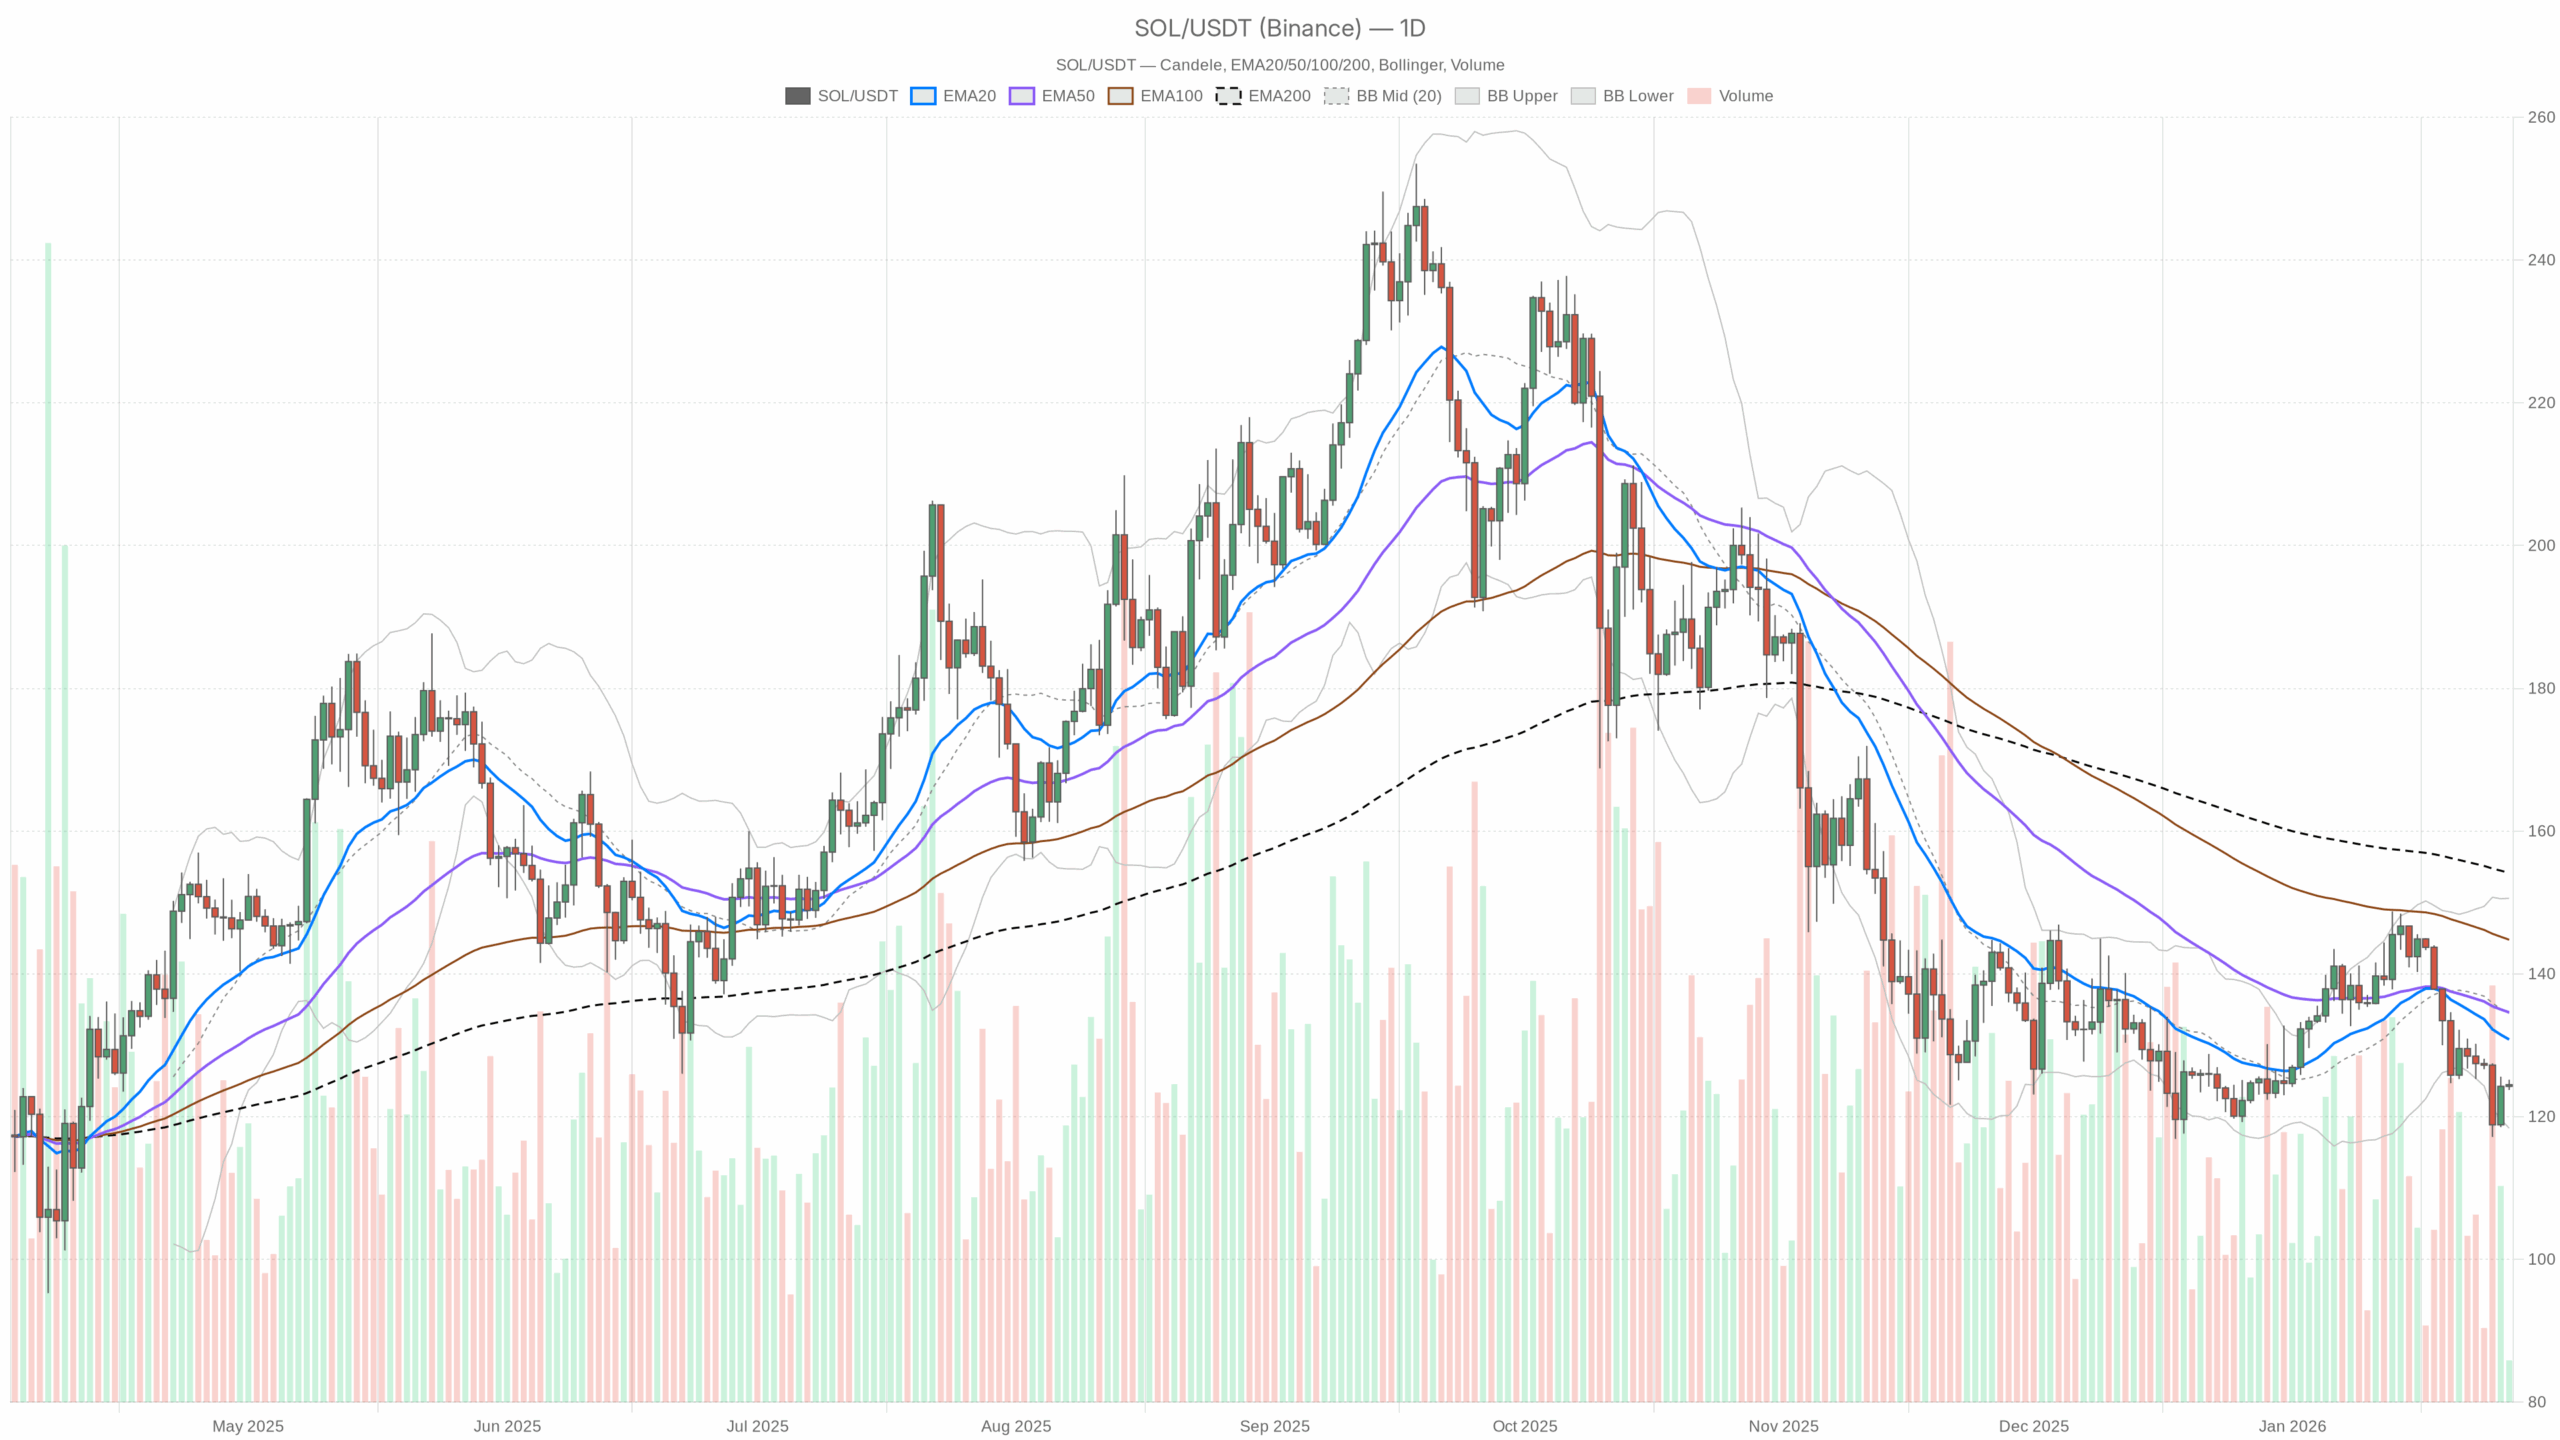 SOL/USDT — daily chart with candles, EMA20/EMA50, and volumes.
Solana Price Today: Technical Rebound Within a Still Bearish Framework
The Solana price today (pair SOLUSDT) is trading around $124.5, with an underlying context still bearish on the daily, while intraday timeframes show a short-term stabilization attempt.
In other words: the main trend remains weak, but the real-time Solana price is trying to build a floor above the $120–123 area. Those looking at today’s quote should therefore keep in mind a two-speed dynamic: medium-term bearish, very short-term neutral-bullish.
Main Direction (Daily): Bearish Context, But Not in Capitulation
On the daily chart, Solana’s value today is at $124.47, below all major moving averages and below the center of the Bollinger Bands. This, along with the “bearish” regime classification, confirms that the dominant force is still distribution/selling pressure, despite some signs of relief.
Daily Exponential Moving Averages (EMA)
- 20-day EMA: $130.8 (above the price)
- 50-day EMA: $134.6 (above the price)
- 200-day EMA: $154.16 (well above the price)
What this tells us: Solana is quoted well below both short and medium-long term averages. The SOL price today reflects a structure still in retracement within a mature bearish trend. As long as the market remains below $130–135, any rebound is technically to be considered a correction within a downtrend, not yet a true reversal.
Daily RSI: Weakness, But Without Excessive Selling
14-day RSI: 41.19
Practical reading: the RSI is below the equilibrium line, so the momentum remains skewed towards sellers, but we are far from an extreme oversold zone. This implies that the market still has room to fall without necessarily triggering a strong technical rebound. At the same time, there is no panic: it is more of a phase of constant pressure than capitulation.
Daily MACD: Bearish Trend Slowing Down
- MACD line: -2.72
- Signal: -0.85
- Histogram: -1.87 (negative)
How to read it: both values are in the negative area, with the histogram still red. The underlying trend is bearish, but the distance is not explosive: it seems more like a phase of progressive weakening than a vertical collapse. For those looking at the Solana price chart, this type of MACD suggests that the decline has been ongoing for a while and could enter a consolidation phase, but there is not yet a clear signal of an upward reversal.
Daily Bollinger Bands: Price in the Lower Part of the Range
- Lower Band: $118.38
- Median Band: $134.48
- Upper Band: $150.58
- Current Price: $124.47
What it means: Solana is moving below the median band and relatively close to the lower band, but not yet “stuck” to it. The Solana quote today is therefore in a zone of structural weakness, but not in an extreme sell-off. This picture is typical of downtrend phases where the price falls in steps, alternating small reactions and new bearish pushes.
Daily ATR: Physiological Volatility, Not Explosive
14-day ATR: $5.59
Operational implications: an average daily range of about $5.5 on a price of $124–125 means a typical range around 4–5% per day. For Solana, this is significant volatility but not extreme, consistent with an orderly descent phase, not with uncontrolled spikes. Those entering the market today must still consider stops and targets that account for at least these $5–6 of natural price breathing.
Daily Pivot Point: Area $124–125 as Short-Term Center
- Central Pivot (PP): $124.46
- Resistance R1: $125.18
- Support S1: $123.74
How to contextualize it: the live Solana price is practically attached to the daily pivot. This means that the market is seeking short-term equilibrium right in this range. A solid daily close above $125 would give a small relief signal, while a decisive break below $123.7 would reopen space towards recent lows in the lower band area ($118–120).
Intraday (H1 and 15m): Attempted Rebound Within a Weak Trend
Moving to more operational timeframes, the real-time Solana quote shows a more balanced picture compared to the daily.
H1: Fragile Equilibrium Above Short-Term Averages
- H1 Price: $124.48
- EMA 20 H1: $124.11
- EMA 50 H1: $124.17
- EMA 200 H1: $128.69
Reading: on the hourly chart, the price is slightly above the short-term EMAs but well below the 200. The intraday picture is defined as “neutral” and reflects just this: a short-term rebound within a still weak underlying structure. For the real-time Solana price, $124–125 is therefore a key level to understand if the rebound has breath or not.
RSI H1: 54.87 → the 1-hour momentum is slightly in favor of buyers, consistent with the small recovery seen since this morning. However, it is not explosive strength: more of an attempt at stabilization.
MACD H1: line 0.33, signal 0.33, histogram ~0 → the hourly MACD is practically flat. This tells of a market without strong direction in the very short term, where the price oscillates but has not yet chosen a decisive direction.
Bollinger Bands H1:
- Median: $124.27
- Upper: $125.13
- Lower: $123.41
The price is just above the median, a signal of a slight advantage for buyers in the very short term, but still within a very compressed range. In practice, the market is making micro-range intra-h1 while waiting for news or stronger moves from Bitcoin.
ATR H1: $0.76 → the hourly volatility is contained, with average movements in the order of 0.5–0.7%. This favors scalping and intraday strategies in a tight range but makes explosive directional movements less likely without an external trigger.
Pivot H1:
- PP: $124.53
- R1: $124.74
- S1: $124.27
The updated Solana price is oscillating right around the hourly pivot. As long as it remains in this corridor $124.3–124.8, the market is in waiting mode. A push above $125 with volumes could unlock some very short-term short covering, but the daily remains unfavorable.
15 Minutes: Micro-Bullish Bias, But Within a Very Tight Range
- Price m15: $124.48
- EMA 20 m15: $124.45
- EMA 50 m15: $124.3
- EMA 200 m15: $124.13
- 15m Regime: bullish
What it really means: on the 15 minutes, all the averages run below the price and are quite close. The SOL price today is therefore driven, in the very short term, by a small local bullish trend, but we are talking about movements of a few tenths of a dollar. It is a tactical rise, not yet something that can change the daily structure.
RSI 15m: 51.19 → slightly above 50, but without strength. The market is more breathing after previous sales than starting for a real bullish leg.
MACD 15m: line 0.02, signal 0.01, histogram 0.01 → just positive signal, consistent with the small intraday bullish bias. But such contained numbers suggest much fragility of the movement: a dump on BTC is enough to cancel the pattern in a few minutes.
Bollinger Bands 15m:
- Median: $124.45
- Upper: $124.80
- Lower: $124.09
The price travels glued to the median, with a very narrow band width. Solana’s trend today in the very short term is of slight upward lateral movement, typical of pre-breakouts but also of false extensions before a new dump.
ATR 15m: $0.29 → the average 15-minute movement is in the order of $0.2–0.3. Intraday traders must therefore avoid tightening stops too much: normal market noise can be enough to hit them without the setup being truly invalidated.
Pivot 15m:
- PP: $124.45
- R1: $124.53
- S1: $124.39
The Solana price today in real-time dances on these levels, in an extremely tight corridor. Operationally, bots and market making dominate here, not yet the true directional flow.
Macro Market Context: Bitcoin Dominant, Sentiment in Fear
- BTC Dominance: ~57.4%
- Total Crypto Market Cap: ~$3.07 trillion (+0.44% in the last 24 hours)
- Fear & Greed Index: 29 (zone Fear)
The general picture is that of a still bitcoin-centric market, with a controlled fear sentiment. We are not in euphoria, on the contrary: the main risk for Solana is that any new BTC plunges further crush the alts, starting with those already below their long-term averages, like SOL.
The positive side for those looking at the Solana price today in euros or dollars is that these fear phases often coincide with areas of medium-term position building by the patient. But the timing remains delicate.
Bullish Scenario on Solana: What Would Be Needed to Talk About Recovery
For a credible bullish scenario, the positive micro-trend on the 15 minutes is not enough. A sequence of signals on multiple timeframes is needed.
What Should Happen (Plausible Bullish)
- Holding the $120–123 area as a base: this zone aligns with the mid-lower part of the daily Bands ($118–120) and with today’s pivot. More days of closing above $120 would build a credible floor.
- Reclaiming $130–135: this is the range that contains EMA 20 ($130.8), EMA 50 ($134.6), and median band ($134.5). A stable return above these levels, with daily RSI rising above 50, would be the first real signal that the downtrend is losing control.
- Daily MACD towards breakeven: a rise of the MACD line towards zero, with the histogram gradually turning green, would show that the medium-term bearish momentum has exhausted.
- Widening of the bands upwards with price above the median: a breakout above $135–140 accompanied by an orderly increase in volatility and volumes would reorient the Solana price chart in an accumulation logic.
Key Levels for the Bullish Scenario:
- First step: $125–126 (above daily R1, confirming the intraday rebound)
- Intermediate resistance: $130 (daily EMA 20)
- Potential reversal zone: $134–135 (EMA 50 + median band)
- Extension: $150 (daily upper band) in case of a more aggressive bullish squeeze
Invalidation of the Bullish Scenario: a decisive daily close below $118–120, with RSI dropping towards 35 and MACD accelerating downwards, would make any structural recovery discussion premature in the short term.
Bearish Scenario on Solana: How Far the Selling Pressure Can Go
The base scenario, as of today, remains slightly bearish, precisely because the daily is below all important averages and the general sentiment is in Fear.
What Could Trigger a New Leg Down
- Break of $123–124: this is the daily S1 support ($123.74) and the lower edge of the current intraday micro-range. A clear loss of this area, with confirmation in h4/daily close, would open space towards $120.
- Test of the lower band at $118.4: a decisive approach to the lower band of the daily Bollinger, with RSI dropping towards 35, would indicate a new wave of selling. Here, the first aggressive buyers might emerge, but the risk of continuation would remain high.
- Possible acceleration below $118: below the lower band, the descent can become faster, with the daily ATR tending to increase. In that case, the Solana price today would enter a phase of more violent volatility, typical of the last legs of a bearish movement or structural support breaks.
Key Levels for the Bearish Scenario:
- Weakness trigger: $123.7 (daily S1)
- Intermediate target: $120 round (psychological level and previous congestion zone)
- Extension target: $118–115 in case of lower band break with panic selling
Invalidation of the Bearish Scenario: a rise and stable consolidation above $135, with the price getting back above the EMA 20 and 50 and daily RSI in the 50–55 area, would significantly weaken the medium-term short narrative.
How to Read Solana’s Price Today: Risks, Opportunities, and False Signals
The combined timeframe picture says this: the Solana price today in euros or dollars is in a middle zone. It is not at the highs where it typically distributes, but it is not at extreme lows where violent rebounds immediately emerge. It is a phase where the market can:
- Gradually build a bottom above $120,
- or slowly slip towards new swing lows if the crypto sentiment worsens.
For a trader, this means:
- Avoid confusing the 15m micro-rebound with a true reversal: the daily trend is still bearish. As long as the updated Solana price remains below $130–135, every bullish leg should be viewed with suspicion.
- Beware of false intraday breakouts: with contained ATR and tight bands on H1 and m15, it is easy to see momentary breaks of R1 or S1 that are then absorbed. Without volumes and without daily alignment, they are often traps.
- Risk management based on ATR: those entering now must size position and stop knowing that a “normal” day can move $5–6; tightening stops too much means giving away entries to the market.
- Consistent multi-timeframe: the daily dictates the trend (bearish), the H1 shows a pause or rebound attempt, the 15m tells the micro-flow. Swing decisions should be based on the daily, using H1 for timing and 15m only to refine the entry, not to change the direction idea.
Those looking at how much Solana is worth today more from an investment perspective than scalping should accept that we are in an area of still high risk, but also in a territory where valuations start to become more interesting compared to previous highs. The compromise is always the same: enter in tranches, respect the mental stop below key supports, and do not be fooled by movements of a few hours.
If you want to monitor the markets in real-time with advanced charts and professional tools, you can open an account on Investing.com!:
Open your Investing.com account
This section contains a sponsored affiliate link. We may earn a commission but at no additional cost to you.
Disclaimer: The information in this article is for informational and educational purposes only and does not constitute an invitation to invest or personalized financial advice. Trading cryptocurrencies involves a high level of risk and may not be suitable for all investors. Carefully consider your objectives, experience, and risk tolerance before trading in the markets.
You May Also Like

Is Doge Losing Steam As Traders Choose Pepeto For The Best Crypto Investment?

Mockery abounds as 'All-American Halftime Show' faces technical difficulties
