

Solana Crypto Price Today: SOLUSDT Pressured Below Key Daily Levels

In a cautious, risk-off crypto environment, Solana crypto price today is under pressure as SOL trades in the lower part of its recent range against USDT.
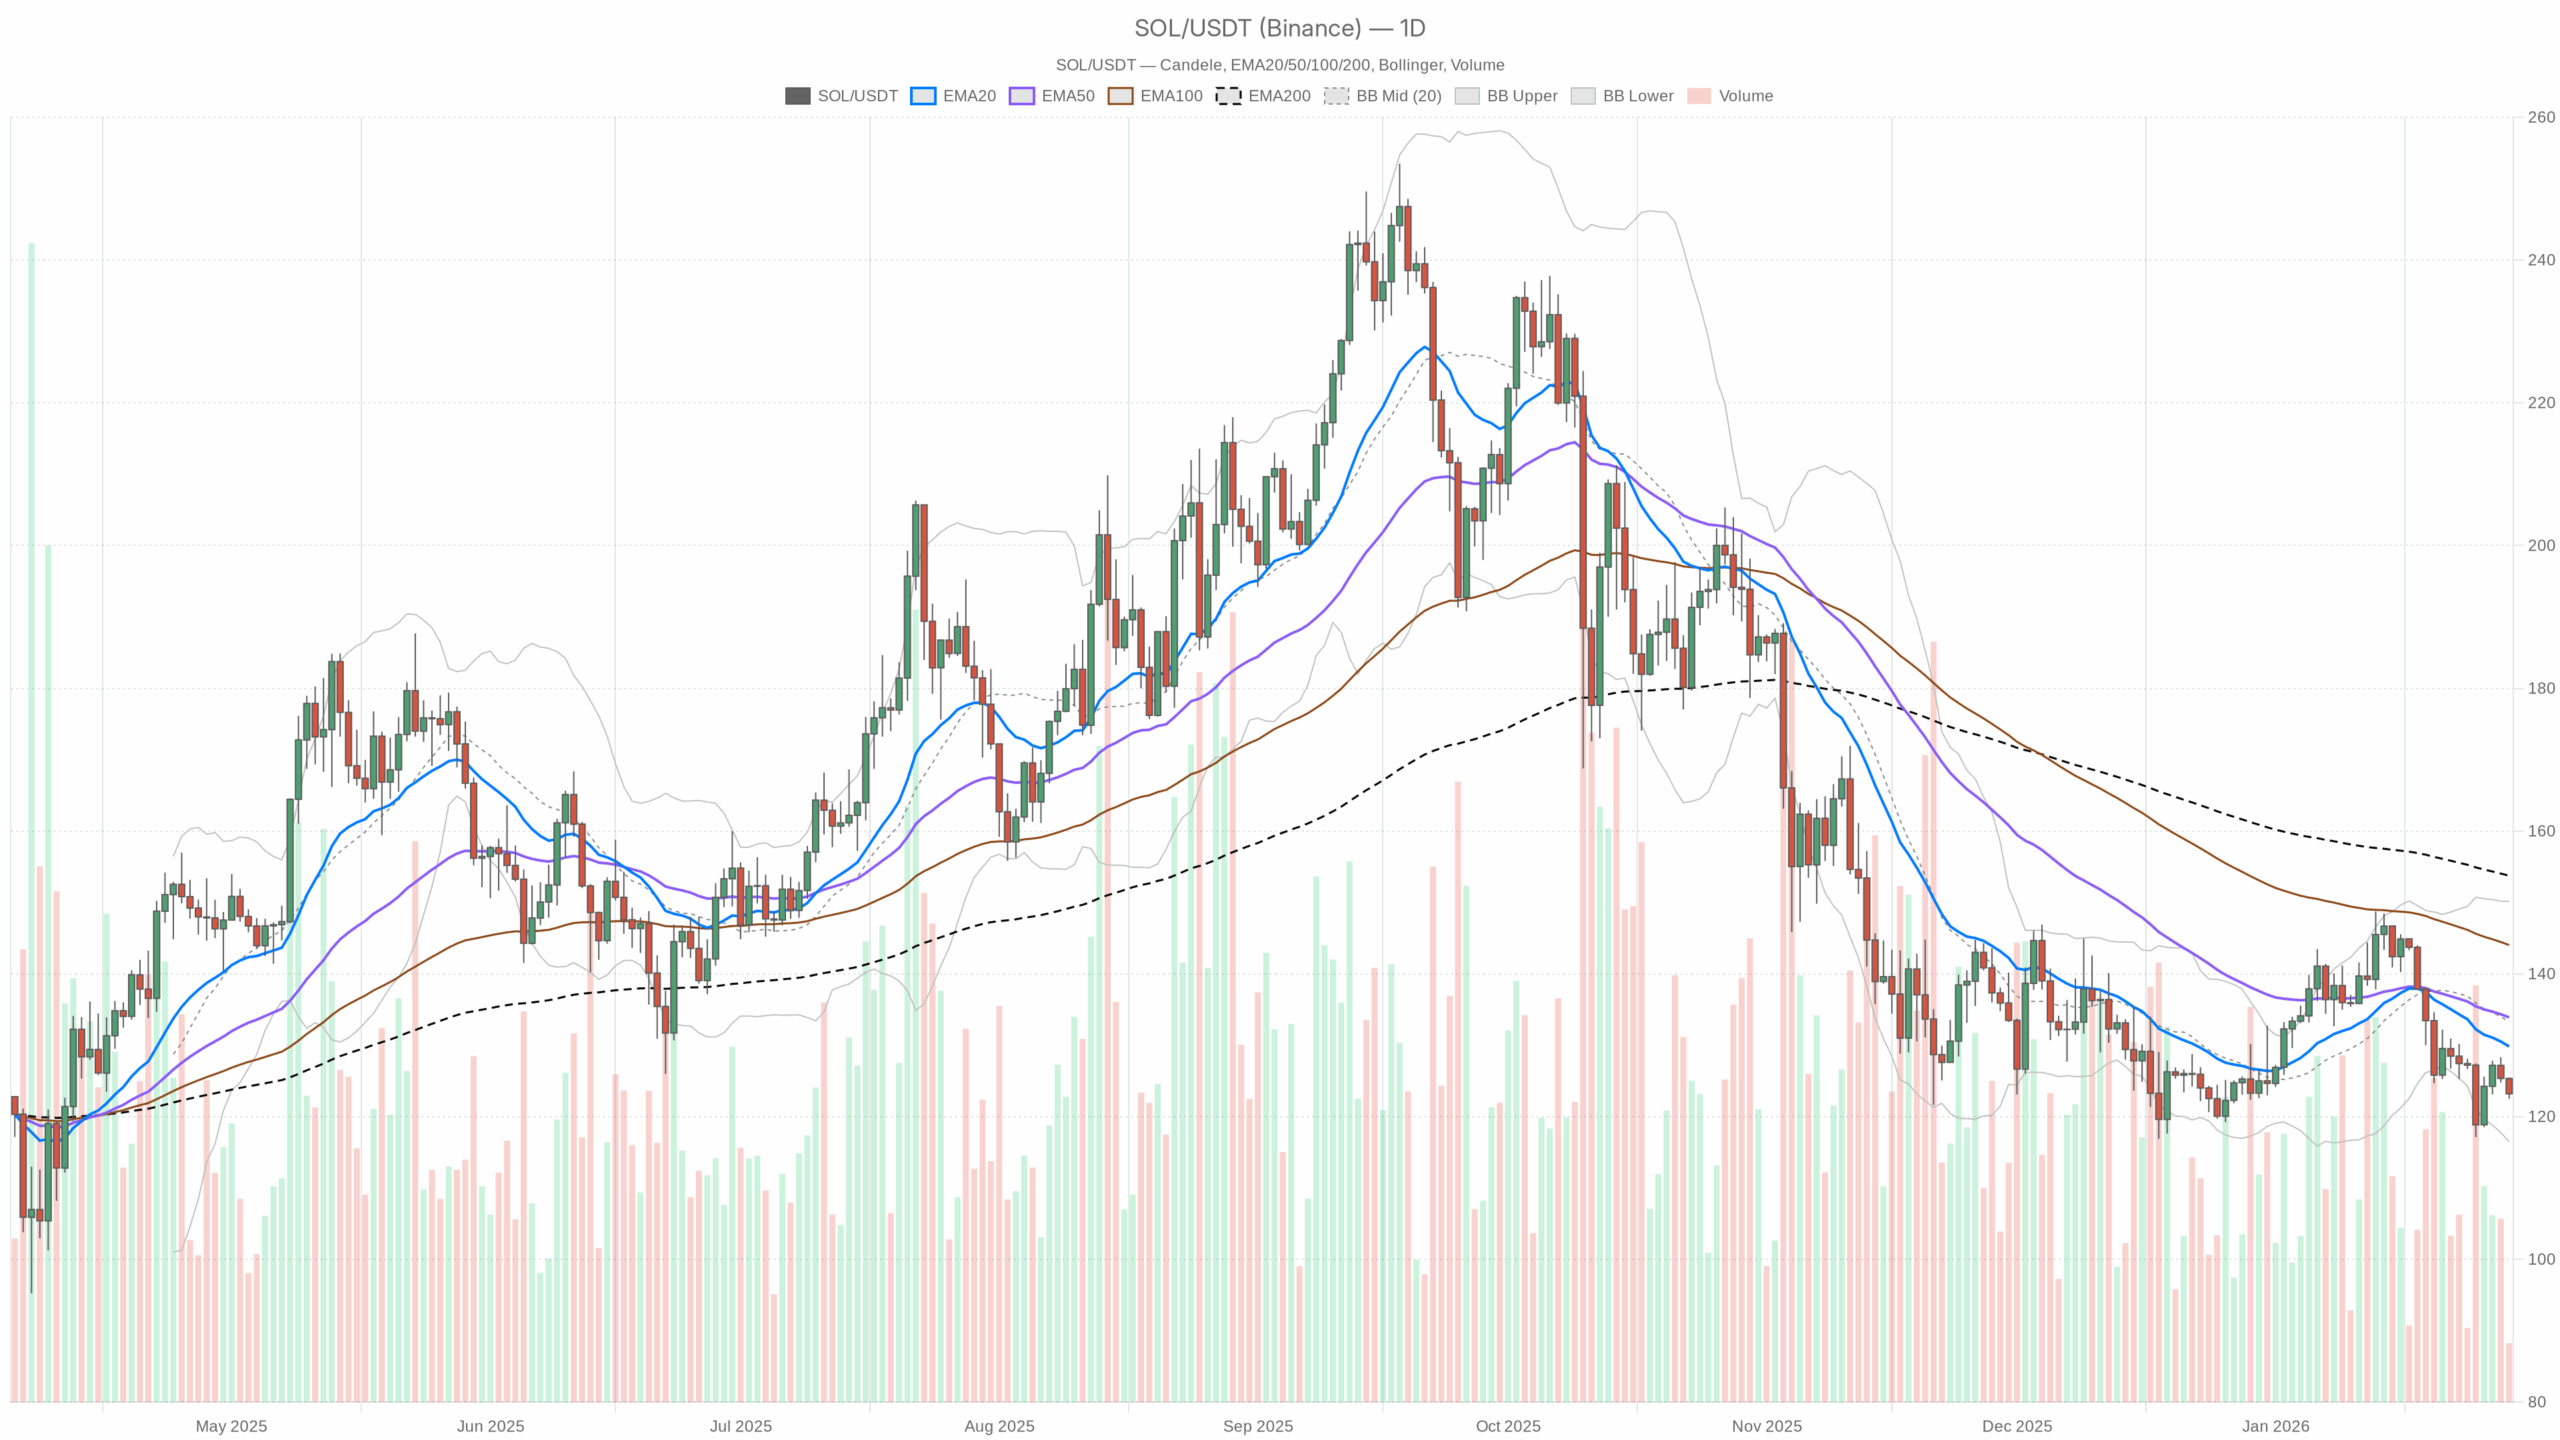 SOL/USDT daily chart with EMA20, EMA50 and volume”
loading=”lazy” />SOL/USDT — daily chart with candlesticks, EMA20/EMA50 and volume.
Solana crypto price today: where SOLUSDT stands
Solana is trading around $123.2 against USDT, sitting in the lower part of its recent range while the broader crypto market is in risk-off mode. BTC dominance is high (about 57%) and total crypto market cap is down roughly 1.6% in 24 hours, with the sentiment index in Fear. This matters: when the market de-risks, high-beta names like SOL usually feel the pressure first and recover later.
On the daily chart, SOL is clearly trading below all major moving averages and underneath the midline of its Bollinger Bands. The dominant force right now is a cooling of speculative appetite and a drift back toward more conservative positioning. The question is whether this is just a corrective phase within a larger uptrend, or the start of a deeper structural repricing.
Given the current structure, the main scenario on D1 is bearish, with downside risk still present but no evidence yet of panic or capitulation.
Daily timeframe (D1): macro bias is bearish
Trend and EMAs (20 / 50 / 200)
– Price: $123.2
– EMA 20: $129.82
– EMA 50: $133.91
– EMA 200: $153.75
SOL is trading below the 20, 50, and 200-day EMAs, with the short EMAs also below the 200-day. That is a classic bearish alignment, where rallies are more likely to be sold into than extended. In practical terms, the $130–135 zone (around the 20 and 50-day EMAs) is now the first meaningful supply area where late buyers could be looking to exit.
RSI (14)
– RSI 14: 40.71
Daily RSI is below 50 but well above oversold. Momentum is negative, but not stretched. This points to a controlled downtrend where sellers are in charge, yet there is still room for further downside before value hunters become aggressive.
MACD
– MACD line: -2.86
– Signal line: -1.51
– Histogram: -1.35
MACD is in negative territory with the line under the signal and a negative histogram. Bearish momentum is established, and the last swing leg down has not been fully unwound yet. There is no clear momentum reversal on D1 at this stage.
Bollinger Bands
– Mid band: $133.33
– Upper band: $150.16
– Lower band: $116.50
– Price vs bands: SOL at $123.2 is trading in the lower half, closer to the bottom band.
Price hovering in the lower half of the bands shows persistent downside bias. However, being above the lower band leaves space for another push lower toward $116–117 without being technically extreme. Volatility is elevated but not explosive.
ATR (14)
– ATR 14: $5.52
Average daily range around $5.5 means a typical swing day can easily cover 4–5% of price. That is enough to pierce local supports or resistances intraday and still close back near them. Position sizing needs to acknowledge this volatility.
Daily pivots
– Pivot point (PP): $123.74
– R1: $124.97
– S1: $121.96
Price is sitting just below the daily pivot. As long as SOL remains under $123.7–125 on closing bases, intraday bounces look more like noise within a broader downswing than the start of a new leg higher. First meaningful daily support from pivots is around $122, then the Bollinger lower band near $116.5.
Overall, the daily chart frames a controlled bearish phase: downtrend structure and negative momentum, but not yet in capitulation territory.
1-hour timeframe (H1): intraday pressure, short-term oversold
Trend and EMAs (20 / 50 / 200)
– Price: $123.2
– EMA 20: $124.54
– EMA 50: $125.12
– EMA 200: $127.44
On H1, price is decisively below all three EMAs, with a clean downward slope. The intraday trend is aligned with the daily bearish bias. Any bounce toward $124.5–125.1 is, for now, just a test of short-term resistance.
RSI (14)
– RSI 14: 33.88
Hourly RSI is near short-term oversold, showing selling pressure has been persistent in the last sessions. This often precedes intraday relief bounces. However, within a downtrend these bounces tend to be shallow unless backed by strong volume or news.
MACD
– MACD line: -0.80
– Signal line: -0.62
– Histogram: -0.18
MACD is negative with a mildly negative histogram. Momentum is bearish, but not accelerating. The latest leg down is losing some speed. This supports the idea of consolidation or a modest bounce rather than an immediate waterfall.
Bollinger Bands
– Mid band: $124.82
– Upper band: $127.35
– Lower band: $122.29
Price is hovering just above the lower band on H1. The move lower has been one-sided intraday, but not so extreme as to demand an immediate snap-back. A drift between $122.5 and $124.5 would be a natural short-term consolidation zone.
ATR (14)
– ATR 14: $0.89
The average hourly move is close to $0.9. On this timeframe, a $2–3 move can happen within a few hours without changing the bigger picture. Short-term traders should expect noise around intraday levels.
Hourly pivots
– Pivot point (PP): $123.18
– R1: $123.40
– S1: $122.98
Price is essentially sitting on the hourly pivot. Sustained trading below $123.2 keeps the door open for a test of $123 and then the lower band around $122.3. Reclaiming and holding above about $123.4 on H1 closes would be the first tiny step toward an intraday bounce.
Overall, the H1 chart confirms the daily bearish bias but also shows short-term exhaustion rather than fresh, aggressive selling.
15-minute timeframe (M15): execution context
Trend and EMAs (20 / 50 / 200)
– Price: $123.2
– EMA 20: $123.51
– EMA 50: $124.11
– EMA 200: $125.03
On M15, price is slightly below the 20 and 50 EMAs and well below the 200 EMA. The micro-trend is bearish but not steep, consistent with a grind lower rather than a sharp dump.
RSI (14)
– RSI 14: 41.98
Short-term RSI is below 50 but far from oversold. Momentum on this micro timeframe has cooled off after earlier selling, which often precedes sideways action or choppy, mean-reversion moves.
MACD
– MACD line: -0.22
– Signal line: -0.22
– Histogram: 0.00
MACD line and signal are effectively on top of each other with a flat histogram. Momentum on M15 is neutralizing, indicating a pause in the move rather than continuation or reversal yet.
Bollinger Bands
– Mid band: $123.50
– Upper band: $124.01
– Lower band: $123.00
Price is mid-to-lower band on M15, with relatively tight bands. Short-term volatility has compressed, which often precedes a small expansion move. Direction will likely follow the higher timeframe bias unless a strong catalyst appears.
ATR (14)
– ATR 14: $0.35
Each 15-minute candle typically ranges around $0.35. Micro moves can test local levels rapidly, so tight stops around intraday structures are vulnerable.
15-minute pivots
– Pivot point (PP): $123.21
– R1: $123.35
– S1: $123.05
Price is sitting right on the M15 pivot. A break and hold above $123.35 on this timeframe would open the way for a test of the M15 and H1 mid-bands. Meanwhile, a drop below $123.05 exposes $123 and then $122.5.
On balance, the 15-minute chart is neutral to mildly bearish, acting mostly as a consolidation layer within the larger downtrend.
Market backdrop: risk-off and Solana ecosystem signals
The wider crypto market shows a clear defensive tilt:
- Total crypto market cap: about $3.06T, down roughly 1.65% in 24 hours
- BTC dominance: roughly 57.3%
- Sentiment: Fear (26)
Money is rotating into Bitcoin relative to altcoins. In this context, Solana underperforming and staying below its key daily EMAs fits the macro picture.
On the DeFi side, Solana-native DEXs such as Raydium, Orca, Meteora, SolFi, and HumidiFi still show substantial fee flows. However, recent 7 to 30 day changes are mixed to negative. Activity is not collapsing, yet it is not in full risk-on mode either. That aligns with SOL’s chart: a healthy ecosystem, but currently out of favor in terms of risk appetite.
Bullish scenario for Solana (counter-trend for now)
For a constructive bullish path, buyers need to show they can turn this from a controlled downtrend into a base.
Key steps on the upside:
1. Stabilization above $121–122
The first task is defending the area between the daily S1 ($121.96) and the lower intraday bands near $122. A series of higher lows on H1 and M15 from this region would signal absorption of selling.
2. Reclaim and hold the $125–130 zone
Short term, H1 closes above $125 would put price back over the 20 and 50 EMAs on H1. Next, a move into $129–130 would challenge the daily 20 EMA ($129.82) and the daily Bollinger midline ($133.33) shortly after.
If SOL can close a day above the 20-day EMA with RSI lifting back above 50 and MACD histogram moving toward zero, the narrative shifts from “sell the rip” to range-building with bullish potential.
3. Target zone: $135–150
In a more extended bounce, the key magnet is the daily 50 EMA around $133.9 and then the Bollinger mid and upper band region up to $150. A strong move into the upper band with rising RSI, but not yet overbought, would mark the first meaningful challenge to the broader bearish structure.
What invalidates the bullish scenario?
A decisive daily close below $116–117 (lower daily band) would indicate that the current support region failed and that selling pressure is still dominant. Moreover, a continued grind under the daily 20 EMA with RSI stuck below 45 for several sessions would also mean bulls are not gaining traction, even if price does not collapse.
As long as Solana stays trapped below $130–135 and fails to reclaim the 20 and 50-day EMAs, any bullish stance is counter-trend and tactical, not structural.
Bearish scenario for Solana (in line with current structure)
The Solana crypto price today setup keeps the bearish case in control on the daily chart.
Key levels and developments for further downside:
1. Break of $121–122 intraday support
If SOL slips and holds below $122 (H1 S1 and lower band cluster), the path opens toward the daily lower Bollinger band around $116.5. With the current ATR, that is well within reach in a single or a couple of sessions.
2. Continuation below $116–117
A daily close under the lower band would confirm a strong downside extension. In that case, you would likely see RSI pushing closer to or below 30 on D1 and MACD expanding deeper into negative territory. That is the phase where forced selling and liquidation risk start to increase.
3. Selling rallies into EMAs
As long as the 20 and 50-day EMAs, roughly $130–135, cap price, every bounce into that area is structurally a potential lower high within the downtrend. Bears will be watching those retests for renewed momentum.
What invalidates the bearish scenario?
A daily close above the 20-day EMA ($129.8), followed by follow-through toward the 50-day EMA, would be the first strong warning that bears are losing control. If, during that move, daily RSI recovers and holds above 50 while MACD flips its histogram positive, the argument for a sustained downtrend weakens sharply.
Until those conditions show up, the path of least resistance remains lower or sideways to lower.
Positioning, risk, and uncertainty
Across timeframes, Solana is in a broadly bearish but not yet oversold phase. Daily structure points down, hourly momentum is weak, and the 15-minute chart is merely digesting recent losses. The market environment is risk-off, with BTC dominance rising and sentiment in fear, which historically is not the friendliest backdrop for altcoins.
The key tactical battleground is the $121–130 range. Holding the lower part around $121–122 and reclaiming $125–130 would open the door to a counter-trend bounce. On the other hand, losing that support and pushing toward $116 and below would extend the existing downtrend and likely bring more volatility.
Volatility, via ATR, is significant enough that levels can be pierced intraday without confirming a true breakout or breakdown. Any strategy, bullish or bearish, needs room for that noise and should be sized with the assumption that 4–5% daily swings are normal in this phase.
Overall, this is a market where patience and respect for higher timeframes matter. The daily chart still rules the playbook, and for now that playbook is defensively tilted for Solana.
If you want to monitor markets with professional charting tools and real-time data, you can open an account on Investing using our partner link:
Open your Investing.com account
This section contains a sponsored affiliate link. We may earn a commission at no additional cost to you.
All market views expressed here are for informational and educational purposes only and do not constitute financial, investment, or trading advice. Cryptoassets are highly volatile and can lead to significant losses. Always conduct your own research and consider your risk tolerance before making any trading decisions.
You May Also Like

Crucial Fed Rate Cut: October Probability Surges to 94%

FCA, crackdown on crypto
