Whale deposits to exchanges: do they cause BTC price drops?
Large Bitcoin holders moving coins to centralized exchanges are often read as preparing to sell, but the relationship with price is probabilistic rather than guaranteed. Impact tends to vary with liquidity, derivatives positioning, and broader sentiment, and some on-chain movements reflect internal transfers or custody rotations rather than immediate sell intent.
Based on data from CryptoQuant, periods of sustained, elevated whale deposits to exchanges have historically aligned with softer BTC performance, suggesting increased sell-side supply can weigh on price. By contrast, Santiment has highlighted episodes where spikes in large-value transactions coincided with accumulation during market dips, indicating whale activity can reflect both distribution and strategic buying.
A practical interpretation is to look for confirmation beyond a single inflow: thinning spot liquidity, negative order-book imbalance, and stressed derivatives metrics can strengthen a bearish read. Absent those corroborating signs, a notable deposit alone may not translate into immediate downside.
Immediate impact: latest Bitcoin exchange inflows and price action
According to Whale Alert, a single transaction of 3,905 BTC moved to a centralized exchange address associated with Kraken, drawing fresh attention to whale-driven supply. Such transfers often heighten short-term sensitivity in order books as traders reassess near-term risk.
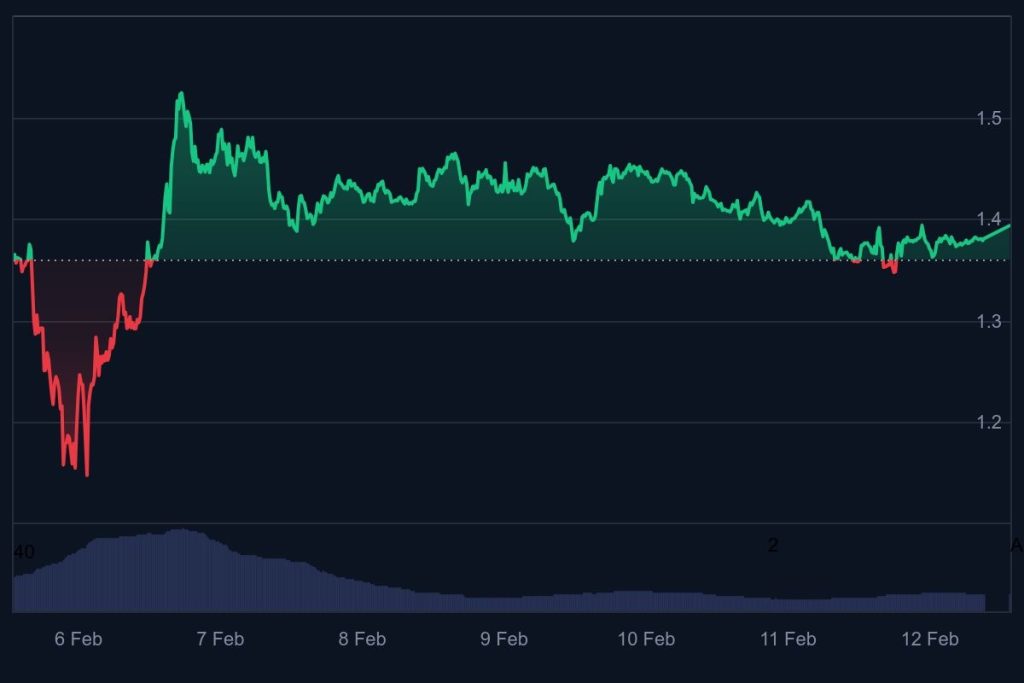
At the time of this writing, Bitcoin traded near $66,908, with very high 12.19% recent volatility, an RSI(14) around 31.13, and spot references below the 50- and 200-day simple moving averages at $85,734 and $101,435, respectively. The accompanying dataset framed short-term sentiment as bearish, though single-point readings can shift quickly with liquidity conditions.
Media coverage of this wallet’s history has emphasized a recurring pattern, an observed drop soon after deposits, while acknowledging that context matters for follow-through. As reported by CryptoPotato, Bitcoin slipped about 3% the last time this whale made a substantial deposit, and the outlet framed the latest move with the headline: “BTC’s Price Dumps Every Time This Whale Deposits: And It Just Happened Again.”
Case study: 3,905 BTC whale transfer and market reaction
As reported by BitcoinWorld, the 3,905 BTC transfer tied to Kraken was a significant blockchain event that captured market attention, illustrating how concentrated flows can sway intraday expectations. The visibility of such transactions often shapes narrative and positioning even before any confirmed selling occurs on the exchange.
Mechanically, moving coins from cold storage to an exchange increases immediately tradable supply, but realized impact depends on follow-through selling, available bid depth, and derivatives context such as open interest or basis alignment. Internal transfers or custody reshuffles can appear identical on-chain, which is why interpreting a single large movement as certain sell pressure can be misleading without corroborating market data.
An academic perspective adds time-horizon nuance: according to a recent paper published on arXiv, whale trading tends to exert more short-run influence on price than long-run, with broader demand and supply forces dominating over extended periods. In that light, the 3,905 BTC transfer may elevate near-term risk, but its ultimate effect likely hinges on subsequent liquidity, order-flow, and whether the coins are actually sold or redistributed.
| Disclaimer: The information provided in this article is for informational purposes only and does not constitute financial, investment, legal, or trading advice. Cryptocurrency markets are highly volatile and involve risk. Readers should conduct their own research and consult with a qualified professional before making any investment decisions. The publisher is not responsible for any losses incurred as a result of reliance on the information contained herein. |