

HYPE Price Analysis Bulls Hold $28, Eye $37.20 Target
HYPE price analysis shows that the token has found stability again after buyers actively defended an important demand area. This defense helped trigger a short-term improvement in bullish momentum, suggesting that sellers have lost some control.
The recent price movement reflects organized market behavior, where technical support and momentum shifts are playing a central role. Liquidity conditions are also influencing direction, indicating that the move is being shaped by market structure rather than speculative activity.
What does HYPE price analysis say about the current structure?
HYPE is moving within a clear upward structure that has shaped its recent price action. A temporary decline pushed this structure to its limits, testing the rising trendline. Buyers stepped in quickly, stopping any deeper drop and keeping the overall bullish setup intact.
 HYPE Price Analysis Bulls Hold $28, Eye $37.20 Target 3
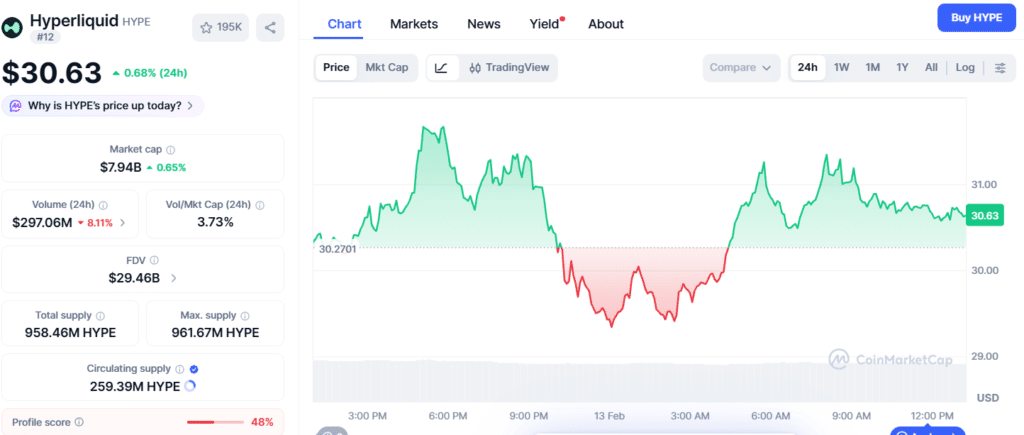
The token is currently trading around $30.67, up 0.99% over the past 24 hours, reflecting a modest recovery above the defended support. This response is important because the strength of a trend often decides whether the HYPE rally continues or stalls. While the defense favored buyers in the short term, the wider move still needs confirmation from the market.
Why did the ascending support zone matter to buyers?
The support zone near $28 has consistently served as a protective level during earlier pullbacks. When selling pressure increased, buying interest appeared quickly, limiting further downside and triggering a rebound. The strength of this response suggested that long position takers were active along the rising support.
This type of market behavior usually points to calculated confidence rather than impulse. From a technical perspective, unsuccessful breakdown attempts often strengthen bullish conviction, particularly when they occur within a well-established uptrend.
How does momentum behavior strengthen this outlook?
Momentum indicators moved in line with the price rebound. The Stochastic RSI turned higher after moving out of oversold territory, indicating that selling pressure was starting to ease. On the one-day timeframe, the Relative Strength Index stands at 52.933, reflecting a neutral market posture, while the Average Directional Index at 27.247 also points to neutral trend strength.
Together, these readings suggest that downside momentum has weakened, giving buyers room to regain short-term control. In this context, HYPE price analysis views the momentum shift as supportive rather than conclusive, with continued buying activity still needed to confirm the recovery.
| Metric | Value |
|---|---|
| Current Price | $30.67 (+0.99% 24h) |
| Key Support | $28 |
| Liquidity Target | $37.20 ($1.32M cluster) |
| Transaction Fees | ~$2M |
| Stochastic RSI | Oversold bounce |
| RSI (1D) | 52.933 |
| ADX (1D) | 27.247 |
| Long Liquidations | $90K (Feb 12) |
| Market Structure | Ascending trendline intact |
What impact do lower transaction costs have on trading activity?
On-chain data indicates that transaction fees have declined to roughly $2 million, reducing the cost of acquiring and transferring the token. Lower transaction costs tend to make market participation more accessible for traders.
This often results in increased activity as participants face fewer barriers when entering or adjusting positions. From a market dynamics standpoint, HYPE price analysis links falling fees with the potential for higher volatility, which can support an ongoing trend if demand remains consistent.
Why is upper-side liquidity becoming a focal point?
Above the current price range, a notable liquidity cluster valued at approximately $1.32 million is positioned near $37.20. Markets often gravitate toward areas where liquidity is concentrated, especially during periods of rising volatility.
If bullish momentum continues to develop, HYPE price analysis highlights this zone as a potential near-term draw for price action. A move in that direction would also help confirm the strength of the recent support defense.
How the recent derivatives reset affects HYPE price analysis and market risk?
On February 12, HYPE’s derivatives market underwent a structural reset, resulting in the liquidation of over $90,000 in long positions during the pullback. This adjustment cleared out concentrated leverage zones, lowering the risk of forced liquidations around current price levels.
From a risk standpoint, HYPE price analysis considers this reset a positive development. With excess leverage removed, future price movements will rely more on new market positions rather than being driven by cascading long squeezes.
What conditions must hold for continuation to unfold?
Despite the supportive signals, confirmation is still necessary. Buyers need to maintain control, and trading activity must increase to keep the upward move intact.
 HYPE Price Analysis Bulls Hold $28, Eye $37.20 Target 4
The defended trendline, lower transaction fees, and a healthier derivatives market all support potential continuation, yet momentum requires further validation. In this context, HYPE price analysis emphasizes that the structure alone cannot sustain a rally without active follow-through from traders.
Conclusion
HYPE price analysis indicates that the token has successfully defended a key ascending support and regained short-term bullish momentum. A notable liquidity cluster near $37.20 serves as a clear technical target if buying activity continues.
While the bulls currently hold the advantage, failure to confirm the move with consistent trading volume could undermine the setup near $28. This leaves the market in a cautious, wait-and-see position, emphasizing the need for follow-through to sustain any upward trend.
Disclaimer: This article is for informational purposes only and is not financial advice. Cryptocurrency trading carries risk, and readers should do their own research before making decisions. HYPE price analysis reflects current market observations and may change as conditions evolve.
Glossary
Trendline: A chart line that shows the main price direction.
Liquidity Cluster: A price level where many orders are placed.
Stochastic RSI: A tool that shows changes in buying or selling strength.
RSI (Relative Strength Index): An indicator that shows if a price is overbought or oversold.
Demand Zone: A price area where strong buying usually appears.
Frequently Asked Questions About HYPE Price Analysis
What is the current HYPE price trend?
HYPE is moving in an upward trend after buyers defended the $28 support level.
Why is the $28 level important for HYPE?
The $28 level is important because buyers stepped in there and stopped the price from falling further.
What is the next price target for HYPE?
The next important price level to watch is $37.20, where strong liquidity is located.
What does liquidity at $37.20 mean?
Liquidity at $37.20 means many orders are placed there, which can attract the price.
What must happen for HYPE to reach $37.20?
HYPE must see continued buying pressure and strong market demand to reach $37.20.
Sources
AMBCrypto
CoinMarketCap
Tradingview
Coinmarketcap
Read More: HYPE Price Analysis Bulls Hold $28, Eye $37.20 Target">HYPE Price Analysis Bulls Hold $28, Eye $37.20 Target
You May Also Like

Markets await Fed’s first 2025 cut, experts bet “this bull market is not even close to over”

Undeniable Synergy: How Guest Posting Fuels SEO, & Backlinks Power
