

Solana (SOL) Price: Weekly Head-and-Shoulders Hints at Drop to $50
TLDR
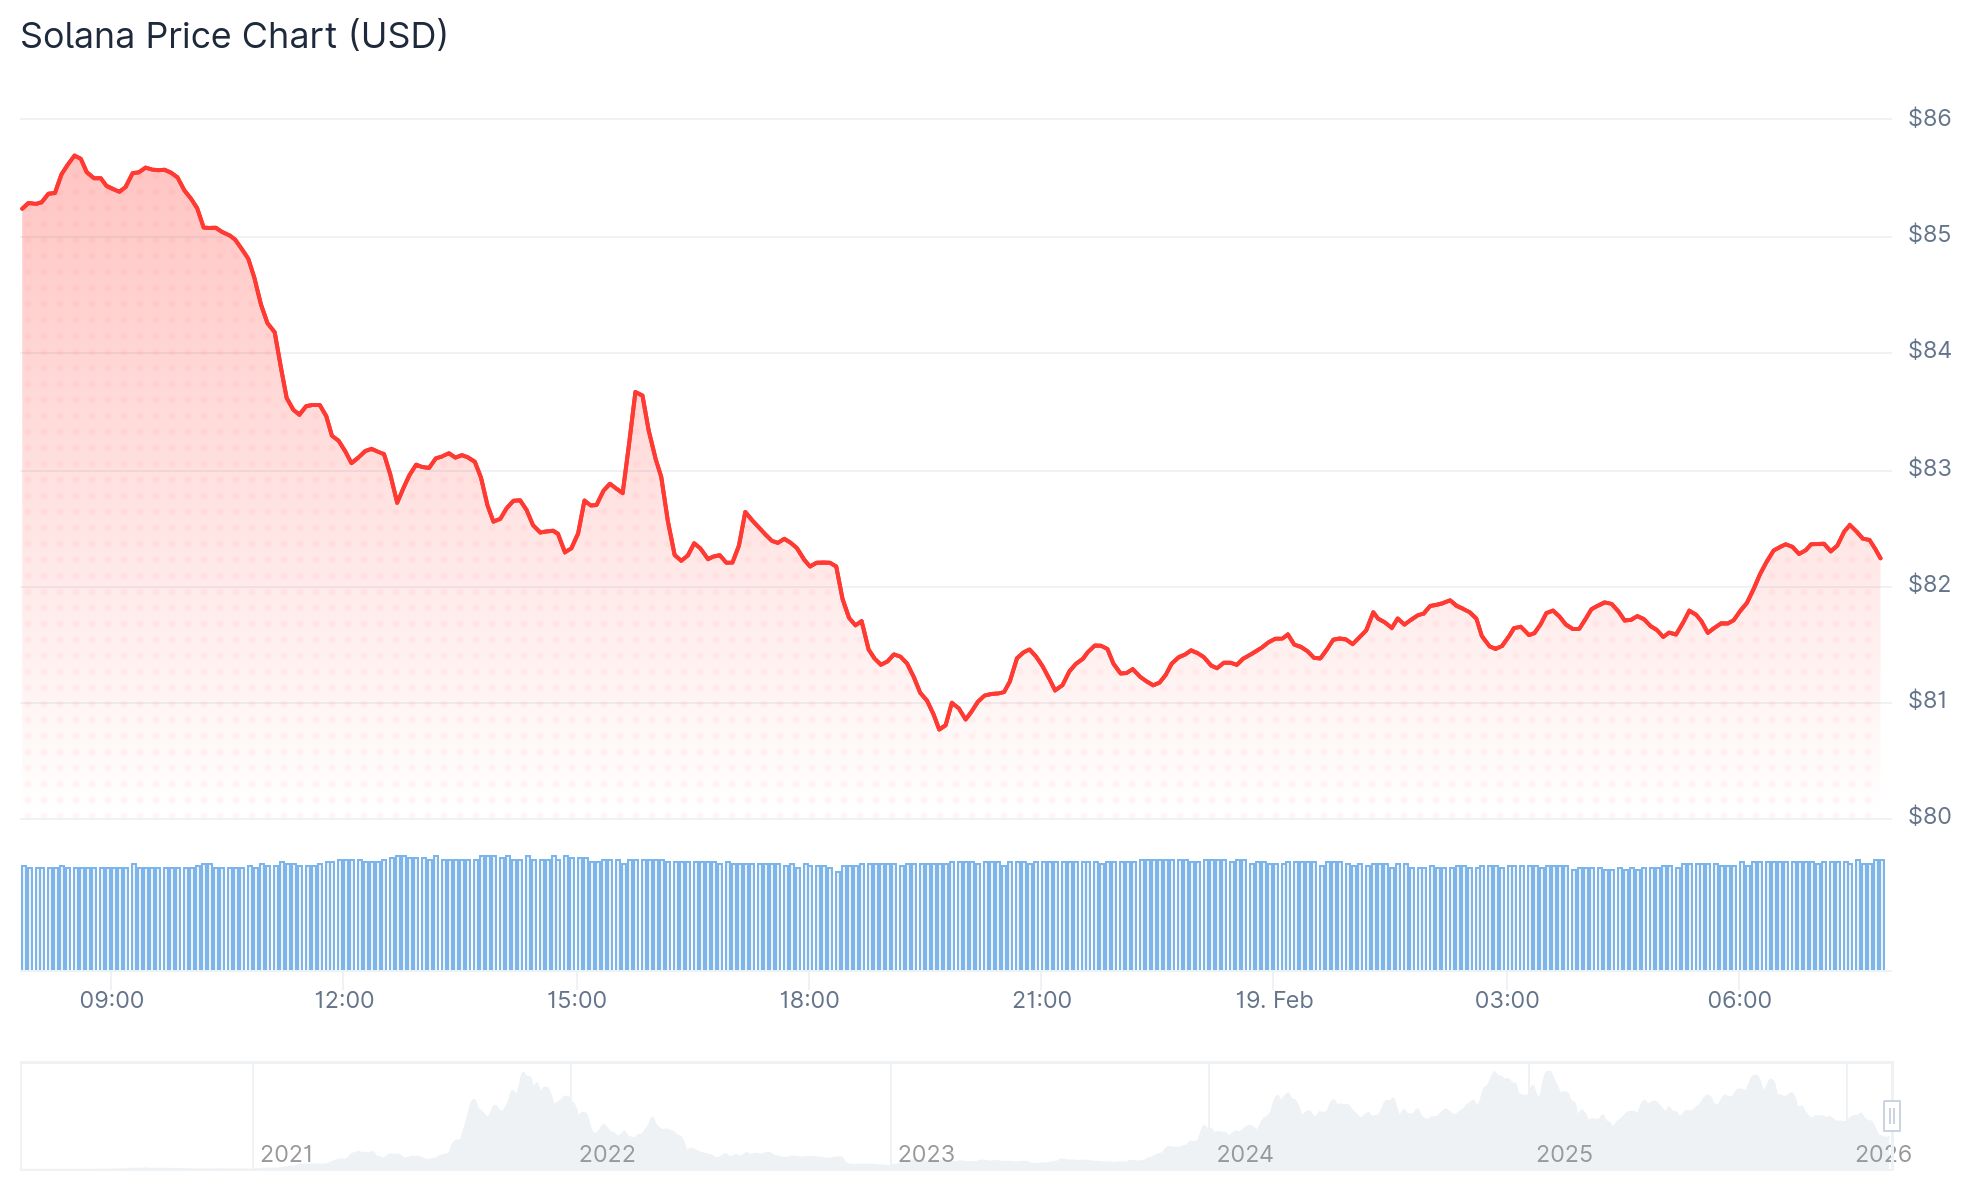
- SOL is trading below $82, more than 72% below its all-time high of $295
- A head-and-shoulders pattern on the weekly chart points to a potential target of $50–$57
- A bear flag on the daily chart could push price toward $48 if SOL closes below $80
- MVRV bands suggest SOL may be near a historical bottom zone around $73
- Spot Solana ETFs have seen inflows in 66 of 74 days, totaling $877 million in cumulative inflows
Solana’s SOL token is trading below $82 as of Thursday, February 19, 2026. The price has fallen more than 72% from its all-time high of $295 and is facing pressure from multiple technical patterns pointing lower.
-
- Solana (SOL) Price
SOL collapsed to $67 on February 6 before recovering slightly. That drop wiped out key support levels and set the stage for the bearish picture analysts are now watching closely.
On the weekly chart, SOL has confirmed a head-and-shoulders (H&S) pattern. The neckline of that pattern broke at $120 on January 30. The measured target from that breakdown sits at $57, roughly 30% below current prices.
On the daily chart, SOL is retesting the lower boundary of a bear flag near $80. A daily close below $80 would confirm that pattern, with a measured target of $48. That would represent a 41% drop from current levels.
Crypto analyst Bitcoinsensus noted that “the next level of support sits around the $50–$60 area,” in line with both technical targets.
MVRV Data Points to a Potential Floor
Despite the bearish technicals, onchain data offers a different view. SOL’s MVRV extreme deviation bands show the lowest boundary sitting near $73. Historically, SOL has found a floor near or at that level before staging sharp recoveries.
-

- Source: Glassnode
In March 2022, SOL bounced 87% within three weeks after testing that same MVRV band around $75. Similar rebounds occurred in June 2022 and December 2020.
The exception was the FTX collapse in November 2022, when SOL broke well below that band and fell 70% further to bottom near $7.
ETF Inflows Stay Steady
Spot Solana ETFs have continued to attract buyers despite the weak price action. These products have recorded inflows in 66 of 74 days since launching in late October 2025.
On Tuesday, spot SOL ETFs added $2.9 million. Cumulative inflows now stand at $877 million, with total net assets under management above $726 million, according to SoSoValue.
-

- Source: SoSoValue
For the week ending February 13, global Solana investment products logged $31 million in net inflows.
On Wednesday, ETFs recorded $2.40 million in inflows, the longest positive streak since February 10. Despite this, SOL’s price did not respond positively.
The FOMC minutes released Wednesday showed Fed officials divided on rate cuts, taking a less dovish tone. That pushed the US Dollar higher and pressured risky assets including SOL and Bitcoin.
Derivatives data from CoinGlass shows the OI-weighted funding rate at -0.0133%, meaning more traders are short than long. However, the long-to-short ratio sits at 1.44, its highest level in over a month, pointing to some bullish positioning.
The RSI reads 32 on the daily chart, approaching oversold territory. The MACD shows a bullish crossover from Sunday that remains intact.
If SOL closes below $76.45, further losses toward the February 6 low of $67.50 are possible.
The post Solana (SOL) Price: Weekly Head-and-Shoulders Hints at Drop to $50 appeared first on CoinCentral.
You May Also Like

Trump insiders privately mock 'far-fetched' plan to use luxury jet for deportations

SUI Eyes Price Recovery As Grayscale, Canary Debut First ETFs
