

ZCash Price Could Drop to $100 if $203 Support Breaks
Highlights:
- ZCash is trending towards $203.56 support after a failed rebound
- Push through $203.56 support could see ZEC drop to lows of $100
- Support breach unlikely as volumes are dropping, indicating seller weakness
ZCash (ZEC) is in the red today, reflecting the ongoing weakness across the cryptocurrency market. When writing, ZCash was trading at $262.67, down by 9.7%. ZCash trading volumes have also dropped in the day, down 12.25% to $333.32 million. This drop in trading volume, along with the price, suggests bear power could be weakening.
That’s because even as the price goes down, short sellers are increasingly cautious of taking positions in ZCash. However, it also means that the average ZCash holder is not keen on selling and may be holding until the trend reverses. Multiple indicators suggest a potential reversal for ZCash in the short term.
Extreme Fear Sentiment Hints at ZCash and Broader Market Rebound
Among them is the fact that the entire cryptocurrency market sentiment is extreme fear. In market psychology, smart money tends to come in at times of extreme fear and sell in times of extreme greed. ZCash and most cryptocurrencies are trading at depressed values, and the Fear & Greed Index is at max fear. This offers a discount for value buyers, who could start making moves at current prices, driving demand back.
As such, there is a strong chance that ZCash could make a V-shaped recovery from current prices in the near term. That’s because, in addition to being massively undervalued at current prices, ZCash has a real-world use case in demand.
Privacy coins are in high demand amid growing pushback against government financial surveillance. Both of these factors could attract big-money players and trigger a reversal for ZCash, sending it back to its recent all-time highs. However, there are macro factors that could keep the fear around ZCash and other cryptocurrencies going, at least in the short term.
Stalled Crypto Bill In the US Could Hold ZCash Back Short Term
One of them is that a major pro-cryptocurrency regulatory initiative has stalled. The Clarity Act is one of the laws that is expected to usher in true mass adoption of cryptocurrencies. However, it has stalled due to a failure by banks and the cryptocurrency industry to agree on stablecoin yields. If this process stalls for longer or the bill passes with no stablecoin yields, it could negatively affect cryptocurrencies in the foreseeable future. That’s because American capital could flow out of stablecoins and the broader cryptocurrency market into stocks and other investments.
Anti-Privacy Regulations In the EU Could Hurt ZCash
Another point of weakness, particularly for ZCash, is the increasingly anti-privacy regulations in the EU. The European Union is set to entirely ban all private financial transactions in a bid to halt illicit trade. This could push investors away from privacy coins, significantly reducing demand. For ZCash, this could mean weak price action even as the rest of the market rallies. The ray of light on this front is that people will always demand privacy and will find a way. This is most evident in Monero’s price action, which continues to perform well despite being delisted from most exchanges.
Technical Analysis – ZCash Targets Support After Failed Rebound
ZCash is red today, after a failed rebound off the $203.56 support. If this price action continues, two things could play out. The first is where ZCash hits $203.56 and enters a consolidation period.
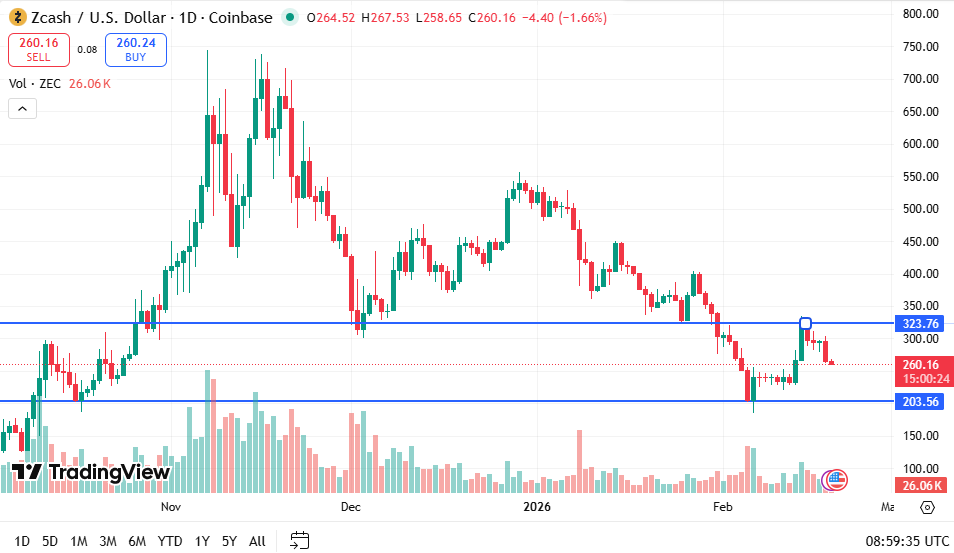 Source: TradingView
The second scenario is one in which bears take control and push ZCash below the $203.56 support level. In such a case, ZCash could drop to prices as low as $100 in the short term. Of these scenarios, the odds are higher for a consolidation around $203.56, and then a potential rebound. That’s because volumes are dropping, an indicator that sellers are getting weaker.
eToro Platform
Best Crypto Exchange
- Over 90 top cryptos to trade
- Regulated by top-tier entities
- User-friendly trading app
- 30+ million users
eToro is a multi-asset investment platform. The value of your investments may go up or down. Your capital is at risk. Don’t invest unless you’re prepared to lose all the money you invest. This is a high-risk investment, and you should not expect to be protected if something goes wrong.
You May Also Like

The Strategic Importance of Corporate Culture in a Tech-Driven Business Environment

Sternlicht Says U.S. Regulation Blocking RWA Tokenization Push
