

BNB Crypto: Oversold Daily, But Still a Counter‑Trend Market

Market conditions remain fragile as BNB crypto trades at a discount within a broader risk-off environment dominated by Bitcoin and defensive positioning.
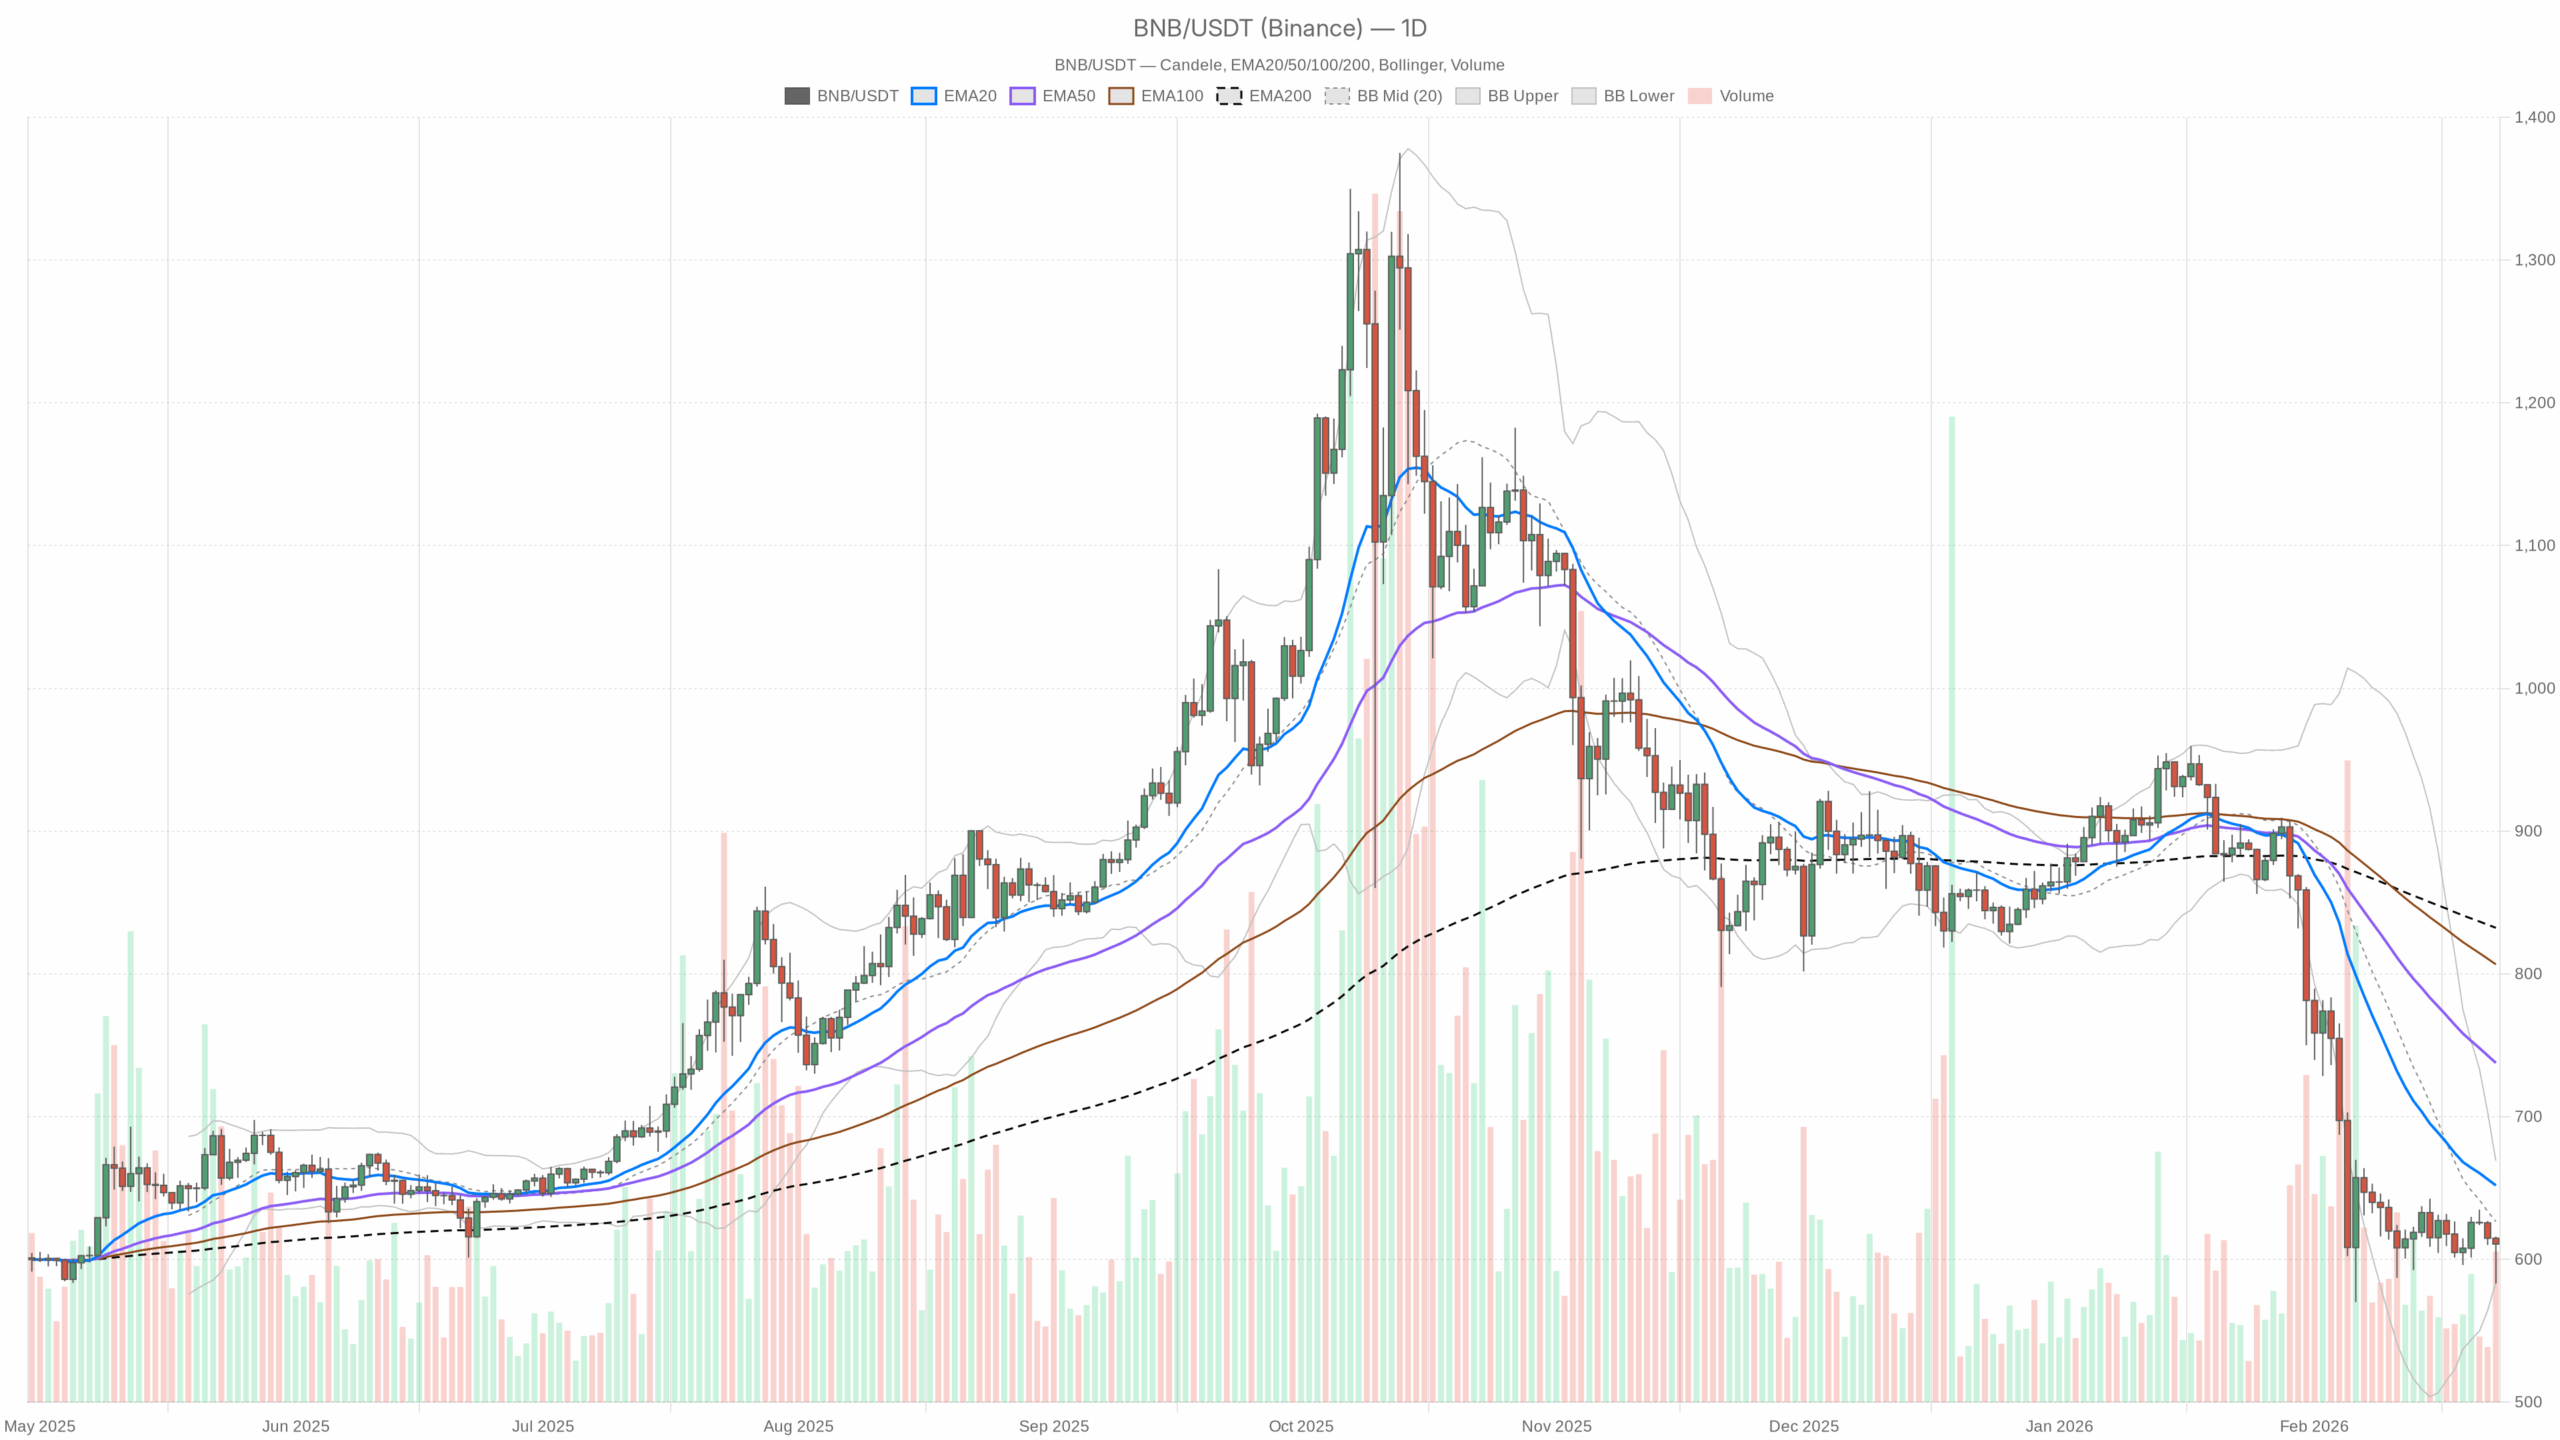 BNB/USDT — daily chart with candlesticks, EMA20/EMA50 and volume.
Big Picture: Fear Is High, BNB crypto Is Discounted, But Trend Is Still Down
BNB crypto is trading around $610–611, in a market that is in extreme fear and broad risk-off mode. Total crypto market cap is down about 1.4% in 24h, Bitcoin dominance sits above 56%, and volumes have spiked sharply. This is a defensive backdrop: capital is clustering in BTC, while crypto like BNB are being marked down.
On the daily timeframe, BNB is firmly in a bearish regime and trading well below its major EMAs, but short-term intraday flows (1H and 15m) show early attempts at stabilisation. This is a classic trend vs. mean-reversion conflict: the dominant move is still down, but the market is cheap enough that counter-trend buyers are probing for a bounce.
Daily Chart (D1): Macro Bias – Bearish With Oversold Characteristics
Price & Regime
BNB crypto daily close: $610.75
Daily regime flag: bearish
BNB is trading below all the key daily moving averages and just under the Bollinger mid-band, with sentiment at extreme fear. The main scenario from the daily chart is still bearish: rallies are guilty until proven innocent. However, momentum has cooled enough that a mean-reversion bounce is increasingly likely before the next major leg resolves.
Daily EMAs (Trend Structure)
- EMA 20: $651.81
- EMA 50: $737.63
- EMA 200: $832.24
- Price: $610.75
Price is sitting well below the 20, 50, and 200-day EMAs. The short-term trend is down, and the longer-term structure has rolled over hard. That gap between spot and the 200-day near $832 shows how deep this drawdown is: BNB is trading in a post-distribution, corrective phase rather than a healthy uptrend.
What it implies: The path of least resistance on the daily chart is still lower. Any bounce up towards the $650–700 band is, by default, a rally into resistance, not yet a trend reversal.
Daily RSI (Momentum / Exhaustion)
- RSI 14 (D1): 32.5
RSI is hovering just above classic oversold territory. Momentum is negative, but the selling is starting to look tired rather than aggressive, and the market has already absorbed a decent hit.
What it implies: Bears are still in control on the higher timeframe, but they are no longer hitting bids with the same intensity. The closer RSI stays to 30 without breaking down further, the higher the odds of a relief bounce or at least sideways digestion instead of a straight-line continuation lower.
Daily MACD (Trend Momentum)
- MACD line: -46.72
- Signal line: -54.94
- Histogram: +8.21
Both the MACD line and signal are deep in negative territory, confirming a firmly bearish trend backdrop. However, the MACD line has started to move up toward the signal line, giving a positive histogram.
What it implies: Trend momentum is still negative, but the downtrend is losing speed. This matches the RSI picture: BNB is in a bearish phase, but downside pressure is easing, which opens the door for a counter-trend bounce if buyers step in.
Daily Bollinger Bands (Volatility & Positioning)
- Middle band (20 SMA): $626.49
- Upper band: $668.97
- Lower band: $584.02
- Price: $610.75
Price is trading between the lower band and the mid-band, closer to the lower edge of the envelope. BNB recently pressed into the lower band area and is now trying to claw back toward the center.
What it implies: The market is still trading in a lower-volatility down-leg, but it is no longer in a waterfall. Being near the lower band signals that the coin is cheap relative to its recent range, which favors short-covering and dip-buying, yet within a broader bearish context.
Daily ATR (Volatility / Risk)
- ATR 14 (D1): $25.24
Daily ATR around $25 means BNB has been swinging roughly 4% of price per day. That is elevated but not extreme for this asset.
What it implies: Volatility is high enough that levels get tested quickly, but the market is not in a capitulation spike. Position sizing needs to respect that a normal day’s noise is in the tens of dollars per coin.
Daily Pivot Levels (Near-Term Map)
- Pivot point (PP): $603.29
- R1: $623.46
- S1: $590.59
- Current price: $610.75 (above PP, below R1)
Price is trading slightly above the daily pivot but still below the first resistance.
What it implies: On the daily map, BNB has managed to stabilise above a key intraday benchmark around $603, which hints at short-term buyers showing up there. However, the $620–625 pocket is the first real barrier bulls need to reclaim for the bounce story to have teeth.
1-Hour Chart (H1): Short-Term Stabilisation Inside a Downtrend
Price & Regime
BNBUSDT 1H close: $610.82
Hourly regime flag: neutral
On the 1-hour chart, BNB is trying to base. The damage from the macro selloff is clear, but the immediate pressure has eased and price is oscillating around short-term moving averages.
1H EMAs (Local Trend)
- EMA 20: $606.36
- EMA 50: $611.39
- EMA 200: $615.52
- Price: $610.82
Price is above the 20 EMA, hovering just under the 50 EMA and below the 200 EMA. Short-term, the market has shifted from heavy selling to a sideways-to-slightly-up bias, while the broader intraday trend (200 EMA) still tilts down.
What it implies: Locally, BNB is attempting a soft recovery. However, the real intraday trendline to watch is the 200 EMA near $615–616; as long as price stays below that on 1H, the bounce is a reaction within a downtrend, not a clean uptrend.
1H RSI (Intraday Momentum)
- RSI 14 (H1): 54.1
RSI around 54 is middle-of-the-road with a modest bullish lean.
What it implies: Intraday, the aggressive selling has stopped, and buyers have a slight edge. There is room in either direction, which makes this an explosive if triggered zone, where whichever side wins the next push can extend for several dollars.
1H MACD (Short-Term Trend Quality)
- MACD line: -1.63
- Signal line: -3.92
- Histogram: +2.29
The MACD is slightly negative but curling up, with the line above the signal.
What it implies: The short-term downtrend on 1H has lost traction, and a mild bullish rotation is underway. This fits with price lifting above the 20 EMA: buying interest is returning, but not yet dominating.
1H Bollinger Bands (Range Context)
- Middle band: $603.57
- Upper band: $623.05
- Lower band: $584.09
- Price: $610.82
Price sits slightly above the 1H mid-band, with bands reasonably wide after the recent volatility.
What it implies: BNB is trading in the upper half of the 1H range, which is constructive for bulls in the short term. However, the upper band around $623 lines up with daily R1, reinforcing that area as the first serious ceiling.
1H ATR (Local Volatility)
- ATR 14 (H1): $6.84
Hourly swings of roughly $7 are normal right now.
What it implies: For intraday traders, moves of 1–2% can happen quickly. Any tight stops inside that noise are likely to get hunted in both directions.
1H Pivot Levels
- Pivot point (PP): $610.44
- R1: $611.21
- S1: $610.06
- Current price: $610.82
Price is pinned almost exactly on the hourly pivot cluster.
What it implies: The market is at a decision point intraday. A push and acceptance above $611–615 would lean the 1H bias bullish, while a drop back under the $610 pivot and especially below $603 would hand momentum back to the bears.
15-Min Chart (M15): Execution Context, Mild Overbought on the Micro
BNBUSDT 15m close: $610.83
15m regime flag: neutral
15m EMAs
- EMA 20: $607.39
- EMA 50: $604.71
- EMA 200: $611.37
- Price: $610.83
Price is above the 20 and 50 EMAs but slightly under the 200 EMA on the 15m chart.
What it implies: Microstructure is short-term bullish inside a still-capped intraday trend. The 15m 200 EMA around $611–612 is acting as a very local lid, aligning with the hourly resistance band.
15m RSI
- RSI 14 (M15): 63.94
On the 15m chart, RSI is leaning toward overbought territory.
What it implies: The latest leg up is getting a bit stretched at this micro timescale. Short-term participants chasing here are late to the move, and a pause or small pullback would be normal before any further advance.
15m MACD
- MACD line: 2.69
- Signal line: 2.66
- Histogram: +0.03
MACD is marginally bullish but basically flat.
What it implies: Momentum from the short squeeze is slowing down on the micro timeframe. There is no clear edge here; this is consolidation territory rather than a fresh breakout or breakdown.
15m Bollinger Bands & ATR
- Middle band: $608.18
- Upper band: $612.38
- Lower band: $603.97
- ATR 14 (M15): $1.99
Price is near the upper 15m band with an ATR around $2 per bar.
What it implies: In the very short term, BNB is hugging the upper edge of its micro range. Small $2 swings are standard noise here, so minor breakouts or breakdowns on 15m need confirmation from 1H levels before they matter.
Market Context: Risk-Off Macro, BNB crypto Specific Angle
The broader crypto tape is under pressure: market cap is down, volumes are up sharply, and the Fear & Greed Index sits in Extreme Fear. Bitcoin and Ethereum have had one of their worst yearly starts in a decade, and news flow is dominated by macro uncertainty, including tariffs, regulatory questions, and growing scrutiny around stablecoin foundations.
For BNB specifically, Binance remains in the headlines, most recently around US growth ambitions and political optics. For now, the chart says this: fundamental noise is playing out in a market that is already positioned defensively. That magnifies both downside if sentiment worsens and upside if risk appetite snaps back.
Scenarios for BNB crypto
Main Scenario (Based on D1): Bearish Bias With Potential for Relief Rallies
Given the daily structure, with price below all major EMAs, RSI near oversold, and MACD deeply negative, the primary scenario for BNB crypto is bearish. The trend is down. Any bounce is assumed to be a counter-trend move until price can reclaim and hold above the key daily moving averages.
Constructive / Bullish Scenario
In the bullish path, the current basing attempt on 1H gains traction and turns into a larger mean-reversion move.
Key steps for that scenario:
1. Hold above daily pivot support around $603 and avoid sustained trade below $590 (daily S1).
2. Break and hold above the 1H & 15m 200 EMAs around $615–620, taking out daily R1 near $623–625 with convincing volume.
3. Use that zone as a new floor, turning it into support on retest, and extend toward the daily mid-band and 20 EMA in the $630–650 area.
If this plays out, you would likely see RSI on the daily climb back toward neutral (40–50) and daily MACD histogram continue to shrink toward zero. Structure-wise, that would still be a bear-market rally, but for active traders it offers a decent upside window.
What invalidates the bullish scenario?
A clean daily close back under $590, especially accompanied by rising ATR and an RSI plunge firmly into the 20s, would suggest the bounce failed and the downtrend is re-accelerating.
Negative / Bearish Scenario
In the bearish extension, the current stabilisation is just a pause before another leg down, in line with the macro risk-off environment.
Key steps for that scenario:
1. Intraday failures around $615–623, with repeated rejections at the 1H and 15m 200 EMAs and daily R1.
2. A break back below the $603 daily pivot, followed by a loss of $590 (S1) without immediate recovery.
3. Daily RSI slipping from low 30s toward the mid-20s and daily MACD making fresh lows, confirming a renewed downside impulse rather than just drift.
Under that path, BNB would likely explore prices below the recent lower Bollinger Band ($584), potentially moving into a true capitulation phase if macro conditions worsen.
What invalidates the bearish scenario?
A sustained move where BNB reclaims and holds above the daily 20 EMA, currently around $652, would seriously weaken the bear case. At that point, the market would start treating dips as buy-the-dip opportunities rather than rallies-to-sell, especially if BTC dominance drops and risk appetite returns.
Positioning, Risk, and Uncertainty
BNB crypto is in a tricky zone: the trend is down, the market is in extreme fear, but short-term momentum is trying to turn. That combination tends to punish both late bears, shorting into oversold conditions, and impulsive bulls, chasing every green candle, in quick succession.
For traders, the key is timeframe alignment:
– If you trade off the daily, the bias is still bearish until BNB can get back above the 20-day EMA and hold. Rallies into the $630–650 region, with weak momentum, fit the profile of counter-trend bounces.
– If you operate on the 1H/15m, you are dealing with a developing base inside a downtrend. The $603–590 support band and the $615–625 resistance zone are the immediate battlegrounds.
Volatility, while not extreme, is high enough that normal intraday swings are meaningful in dollar terms. In this environment, size and risk management matter more than directional conviction. The chart right now does not reward certainty; it rewards patience and respect for both the prevailing downtrend and the possibility of sharp mean-reversion rallies.
Overall, BNB remains a counter-trend market on the daily timeframe, with oversold characteristics and tactically interesting, yet still risky, bounce potential within a clearly bearish backdrop.
You May Also Like

Trump suggests he wants to send Americans 'that don't work' to other countries

Gold continues to hit new highs. How to invest in gold in the crypto market?
