Gold Enters Bear Market Territory — Here’s Why Analysts Are Still Bullish
TLDR
- Gold futures dipped 0.2% to $4,400.50 an ounce on Tuesday as the U.S. dollar strengthened.
- Spot gold fell as much as 2% and is now down roughly 21% from its late-January peak of $5,594.82.
- Saudi Arabia’s decision to let U.S. forces use King Fahd air base added to market uncertainty.
- Despite the bear market, analysts at Global X ETFs and Standard Chartered still see gold reaching $5,375–$6,000 by year-end.
- Ed Yardeni of Yardeni Research maintained his $10,000 per ounce forecast by end of the decade.
Gold has entered a bear market, dropping more than 20% from its January highs. But several analysts say the selloff may not last.
Spot gold fell as much as 2% on Tuesday before trimming losses, last trading at $4,335.97 an ounce. Futures dropped about 2% to $4,317.80. The metal is now down roughly 21% from its late-January peak of $5,594.82.
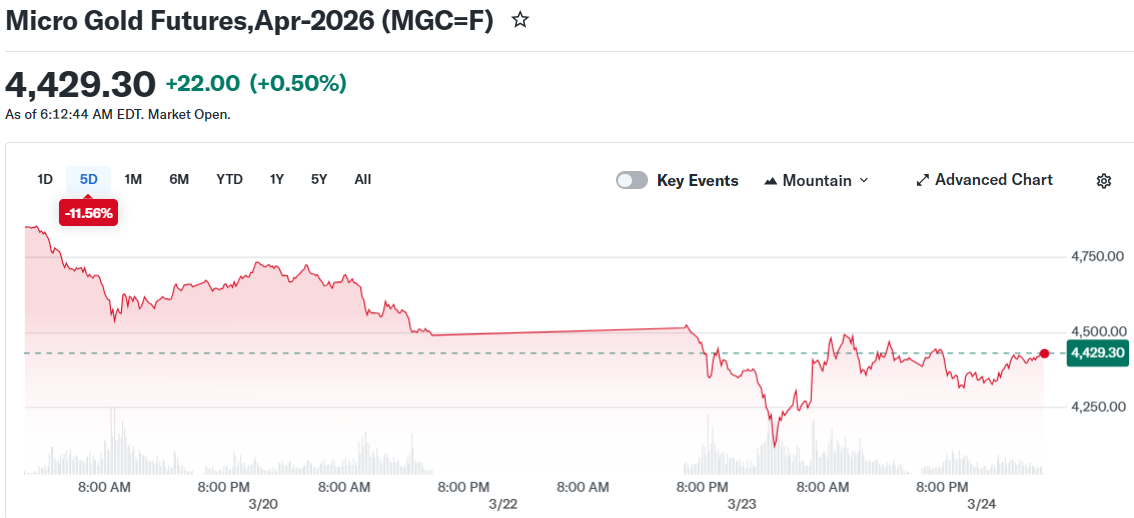 Micro Gold Futures,Apr-2026 (MGC=F)
Continuous gold futures also fell 0.2% to $4,400.50 per ounce. The U.S. Dollar Index rose 0.4%, adding pressure on the precious metal. Because gold is priced in dollars, a stronger greenback makes it more expensive for foreign buyers.
Gold has lost 17% of its value since the beginning of March, according to FactSet data. The dollar index has gained around 3% since the conflict with Iran began on February 28.
Tuesday’s price drop came partly after a Wall Street Journal report that Saudi Arabia agreed to let U.S. forces use King Fahd air base. The move marked a shift from the kingdom’s earlier position that its facilities would not be used in the war with Iran.
Neil Welsh, head of metals at Britannia Global Markets, said markets remain highly reactive to geopolitical developments. With no clear path toward de-escalation, he said traders should expect continued volatility in the gold market.
The selloff also came after U.S. President Donald Trump said on Monday he had ordered a five-day pause on planned strikes against Iran’s energy infrastructure. That news helped ease some of the geopolitical tension that had been supporting gold prices.
Why Analysts Still See Gold Rising
Despite the sharp drop, many strategists do not see this as a turning point for gold. They point to central bank demand, geopolitical uncertainty, and the prospect of a weaker dollar as reasons to stay bullish.
Ed Yardeni, president of Yardeni Research, lowered his year-end target to $5,000 per ounce from $6,000. But he told CNBC he is keeping his long-term forecast of $10,000 per ounce by the end of the decade.
Lin said his bullish outlook does not depend on the Iran conflict. He cited central bank buying and inflows from Asian gold exchange-traded fund investors as the key drivers.
Standard Chartered also remains positive on gold. Senior Investment Strategist Rajat Bhattacharya said the bank expects gold to rebound toward $5,375 over the next three months, once the current wave of selling runs its course. He cited technical support around the $4,100 level.
Central Banks Seen as a Key Stabilizer
Emerging market central banks have been buying gold steadily as they diversify away from the U.S. dollar. Lin said there is a “high likelihood” that central banks increase purchases following the recent selloff.
Bhattacharya added that a weaker U.S. dollar would once again support gold prices. Markets expect the Federal Reserve to cut interest rates at some point, which could put downward pressure on the dollar.
Standard Chartered sees technical support for gold around the $4,100 level.
The post Gold Enters Bear Market Territory — Here’s Why Analysts Are Still Bullish appeared first on CoinCentral.
You May Also Like

DOGE May Regain Hype, but Traders Look Toward MUTM Just Crossing $16M as the Top Crypto for 700% ROI

WADESK Just Dropped the Ultimate WASender Free Tool for Marketers