Ostium Research’s latest weekly note opened with Bitcoin under pressure after a swift selloff into the new week, describing “a mass liquidation event” that pushed price as low as $111,761, after rejection near resistance in the mid-$117,000s. The team frames the drawdown as part of a previously flagged “window of weakness… into early October,” while stressing the higher-timeframe uptrend remains intact unless key weekly levels fail. The report, published September 22, 2025, sets out both the technical map and the event calendar that could govern path-dependency over the next several sessions. Bitcoin Crash To $99,000 Looms On the weekly chart, Ostium notes last week’s consolidation around the August open and a wick into “key resistance… at $117.5k,” followed by a close marginally below the open. Early-week price action then carried price beneath reclaimed support into the $111k handle, with the analysts highlighting “over $1.6bn in longs liquidated so far today.” Two structural inflection zones anchor the bearish risk: “Acceptance below $107k on a weekly close would open up more downside into $99k,” whereas on the topside “the weekly high at $115.3k… is at least revisited some time later in the week.” Related Reading: Bitcoin Fear & Greed Index Signals ‘Fear’ As Price Falls To $112,000 On the daily timeframe, the August open at $115.7k is the pivot the market must reclaim to reassert momentum. As the authors put it, “that August open at $115.7k [is] a key level to flip into support to resume bullishness.” The immediate battleground is the prior all-time high at $112k, where “a reclaim of $112k as support” would tilt probabilities toward a higher low and force shorts to cover into a move back through $115.7k. Their base case, however, is for additional chop “between $112k-$115k before a second push lower below today’s low,” which will determine whether the market undercuts the June swing at $107k or marks out a bottom sooner. Tactically, Ostium lays out both long and short triggers with unusual clarity. On the long side: “a sweep of today’s low early this week and then a reclaim of $112k as support,” riding momentum “back into the weekly high.” On the short side, they float what they call “a really nice short setup… a sharp v-reversal… back above the weekly high… before… rejecting and breaking back below $115.3k,” which would then target “$112k and lower.” In other words, a squeeze-then-fade path that punishes both late longs and late shorts. Related Reading: Bitcoin Stuck In Neutral While Markets Roar — Analyst Explains Why Positioning and derivatives breadth round out the near-term blueprint. The note shares snapshots of 3-month annualized basis, Bitcoin versus altcoin open interest, and one-week/one-month liquidation maps, underscoring how quickly liquidity pockets can flip into magnets in thin conditions. This informs their near-term expectation that “the next leg lower or second liquidation event this week [could] be a high probability low,” followed by a retest of $115.3k that will act as the tape’s verdict on whether another down-leg or a bear-trap reversal is in play into quarter-end. The house view remains probabilistic rather than doctrinaire. If $107k fails on a weekly close, the weakness window could extend into “$99k”; if it holds—and especially if the market can “flip $115.7k into support”—the higher-low narrative stays alive. In the authors’ words, for Ethereum “nothing about this higher timeframe structure or momentum is currently giga-bearish,” and, by analogy, Bitcoin’s structure is best judged by the reaction around $111.7k–$112k this week. Whether today’s flush proves to be prelude to capitulation or the trap before new highs, Ostium’s bottom line is clear: “we move much higher from early October” unless those weekly thresholds are accepted lower. At press time, BTC traded at $113,002. Featured image created with DALL.E, chart from TradingView.comOstium Research’s latest weekly note opened with Bitcoin under pressure after a swift selloff into the new week, describing “a mass liquidation event” that pushed price as low as $111,761, after rejection near resistance in the mid-$117,000s. The team frames the drawdown as part of a previously flagged “window of weakness… into early October,” while stressing the higher-timeframe uptrend remains intact unless key weekly levels fail. The report, published September 22, 2025, sets out both the technical map and the event calendar that could govern path-dependency over the next several sessions. Bitcoin Crash To $99,000 Looms On the weekly chart, Ostium notes last week’s consolidation around the August open and a wick into “key resistance… at $117.5k,” followed by a close marginally below the open. Early-week price action then carried price beneath reclaimed support into the $111k handle, with the analysts highlighting “over $1.6bn in longs liquidated so far today.” Two structural inflection zones anchor the bearish risk: “Acceptance below $107k on a weekly close would open up more downside into $99k,” whereas on the topside “the weekly high at $115.3k… is at least revisited some time later in the week.” Related Reading: Bitcoin Fear & Greed Index Signals ‘Fear’ As Price Falls To $112,000 On the daily timeframe, the August open at $115.7k is the pivot the market must reclaim to reassert momentum. As the authors put it, “that August open at $115.7k [is] a key level to flip into support to resume bullishness.” The immediate battleground is the prior all-time high at $112k, where “a reclaim of $112k as support” would tilt probabilities toward a higher low and force shorts to cover into a move back through $115.7k. Their base case, however, is for additional chop “between $112k-$115k before a second push lower below today’s low,” which will determine whether the market undercuts the June swing at $107k or marks out a bottom sooner. Tactically, Ostium lays out both long and short triggers with unusual clarity. On the long side: “a sweep of today’s low early this week and then a reclaim of $112k as support,” riding momentum “back into the weekly high.” On the short side, they float what they call “a really nice short setup… a sharp v-reversal… back above the weekly high… before… rejecting and breaking back below $115.3k,” which would then target “$112k and lower.” In other words, a squeeze-then-fade path that punishes both late longs and late shorts. Related Reading: Bitcoin Stuck In Neutral While Markets Roar — Analyst Explains Why Positioning and derivatives breadth round out the near-term blueprint. The note shares snapshots of 3-month annualized basis, Bitcoin versus altcoin open interest, and one-week/one-month liquidation maps, underscoring how quickly liquidity pockets can flip into magnets in thin conditions. This informs their near-term expectation that “the next leg lower or second liquidation event this week [could] be a high probability low,” followed by a retest of $115.3k that will act as the tape’s verdict on whether another down-leg or a bear-trap reversal is in play into quarter-end. The house view remains probabilistic rather than doctrinaire. If $107k fails on a weekly close, the weakness window could extend into “$99k”; if it holds—and especially if the market can “flip $115.7k into support”—the higher-low narrative stays alive. In the authors’ words, for Ethereum “nothing about this higher timeframe structure or momentum is currently giga-bearish,” and, by analogy, Bitcoin’s structure is best judged by the reaction around $111.7k–$112k this week. Whether today’s flush proves to be prelude to capitulation or the trap before new highs, Ostium’s bottom line is clear: “we move much higher from early October” unless those weekly thresholds are accepted lower. At press time, BTC traded at $113,002. Featured image created with DALL.E, chart from TradingView.com

Bitcoin Price Could Still Crash To $99,000 If This Happens, Warns Ostium Labs

2025/09/23 19:30

Ostium Research’s latest weekly note opened with Bitcoin under pressure after a swift selloff into the new week, describing “a mass liquidation event” that pushed price as low as $111,761, after rejection near resistance in the mid-$117,000s.

The team frames the drawdown as part of a previously flagged “window of weakness… into early October,” while stressing the higher-timeframe uptrend remains intact unless key weekly levels fail. The report, published September 22, 2025, sets out both the technical map and the event calendar that could govern path-dependency over the next several sessions.

Bitcoin Crash To $99,000 Looms

On the weekly chart, Ostium notes last week’s consolidation around the August open and a wick into “key resistance… at $117.5k,” followed by a close marginally below the open. Early-week price action then carried price beneath reclaimed support into the $111k handle, with the analysts highlighting “over $1.6bn in longs liquidated so far today.”
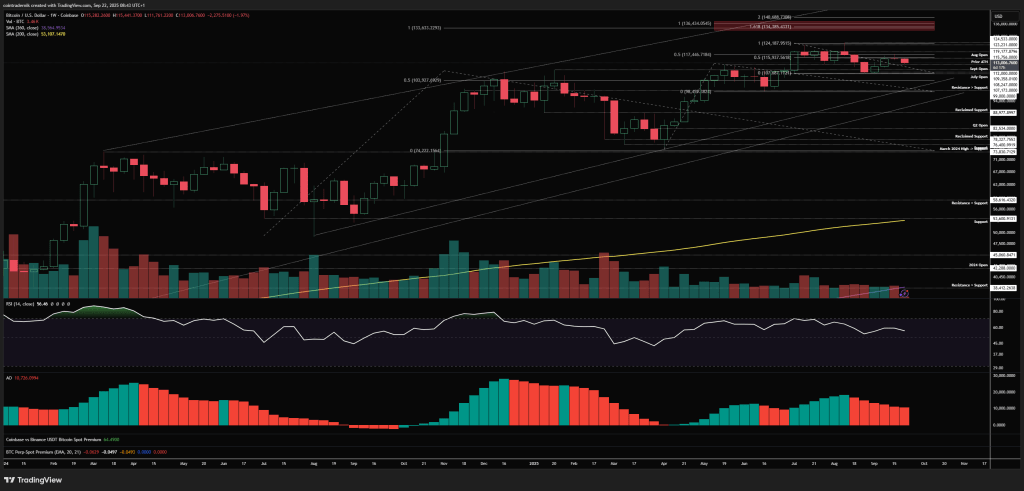
Bitcoin weekly chart

Two structural inflection zones anchor the bearish risk: “Acceptance below $107k on a weekly close would open up more downside into $99k,” whereas on the topside “the weekly high at $115.3k… is at least revisited some time later in the week.”

On the daily timeframe, the August open at $115.7k is the pivot the market must reclaim to reassert momentum. As the authors put it, “that August open at $115.7k [is] a key level to flip into support to resume bullishness.”

The immediate battleground is the prior all-time high at $112k, where “a reclaim of $112k as support” would tilt probabilities toward a higher low and force shorts to cover into a move back through $115.7k. Their base case, however, is for additional chop “between $112k-$115k before a second push lower below today’s low,” which will determine whether the market undercuts the June swing at $107k or marks out a bottom sooner.

Bitcoin daily chart

Tactically, Ostium lays out both long and short triggers with unusual clarity. On the long side: “a sweep of today’s low early this week and then a reclaim of $112k as support,” riding momentum “back into the weekly high.” On the short side, they float what they call “a really nice short setup… a sharp v-reversal… back above the weekly high… before… rejecting and breaking back below $115.3k,” which would then target “$112k and lower.” In other words, a squeeze-then-fade path that punishes both late longs and late shorts.

Positioning and derivatives breadth round out the near-term blueprint. The note shares snapshots of 3-month annualized basis, Bitcoin versus altcoin open interest, and one-week/one-month liquidation maps, underscoring how quickly liquidity pockets can flip into magnets in thin conditions.

This informs their near-term expectation that “the next leg lower or second liquidation event this week [could] be a high probability low,” followed by a retest of $115.3k that will act as the tape’s verdict on whether another down-leg or a bear-trap reversal is in play into quarter-end.

The house view remains probabilistic rather than doctrinaire. If $107k fails on a weekly close, the weakness window could extend into “$99k”; if it holds—and especially if the market can “flip $115.7k into support”—the higher-low narrative stays alive. In the authors’ words, for Ethereum “nothing about this higher timeframe structure or momentum is currently giga-bearish,” and, by analogy, Bitcoin’s structure is best judged by the reaction around $111.7k–$112k this week.

Whether today’s flush proves to be prelude to capitulation or the trap before new highs, Ostium’s bottom line is clear: “we move much higher from early October” unless those weekly thresholds are accepted lower.

At press time, BTC traded at $113,002.

Bitcoin price
Disclaimer: The articles reposted on this site are sourced from public platforms and are provided for informational purposes only. They do not necessarily reflect the views of MEXC. All rights remain with the original authors. If you believe any content infringes on third-party rights, please contact service@support.mexc.com for removal. MEXC makes no guarantees regarding the accuracy, completeness, or timeliness of the content and is not responsible for any actions taken based on the information provided. The content does not constitute financial, legal, or other professional advice, nor should it be considered a recommendation or endorsement by MEXC.

You May Also Like

Aave DAO to Shut Down 50% of L2s While Doubling Down on GHO

Aave DAO to Shut Down 50% of L2s While Doubling Down on GHO

The post Aave DAO to Shut Down 50% of L2s While Doubling Down on GHO appeared on BitcoinEthereumNews.com. Aave DAO is gearing up for a significant overhaul by shutting down over 50% of underperforming L2 instances. It is also restructuring its governance framework and deploying over $100 million to boost GHO. This could be a pivotal moment that propels Aave back to the forefront of on-chain lending or sparks unprecedented controversy within the DeFi community. Sponsored Sponsored ACI Proposes Shutting Down 50% of L2s The “State of the Union” report by the Aave Chan Initiative (ACI) paints a candid picture. After a turbulent period in the DeFi market and internal challenges, Aave (AAVE) now leads in key metrics: TVL, revenue, market share, and borrowing volume. Aave’s annual revenue of $130 million surpasses the combined cash reserves of its competitors. Tokenomics improvements and the AAVE token buyback program have also contributed to the ecosystem’s growth. Aave global metrics. Source: Aave However, the ACI’s report also highlights several pain points. First, regarding the Layer-2 (L2) strategy. While Aave’s L2 strategy was once a key driver of success, it is no longer fit for purpose. Over half of Aave’s instances on L2s and alt-L1s are not economically viable. Based on year-to-date data, over 86.6% of Aave’s revenue comes from the mainnet, indicating that everything else is a side quest. On this basis, ACI proposes closing underperforming networks. The DAO should invest in key networks with significant differentiators. Second, ACI is pushing for a complete overhaul of the “friendly fork” framework, as most have been unimpressive regarding TVL and revenue. In some cases, attackers have exploited them to Aave’s detriment, as seen with Spark. Sponsored Sponsored “The friendly fork model had a good intention but bad execution where the DAO was too friendly towards these forks, allowing the DAO only little upside,” the report states. Third, the instance model, once a smart…
Share
BitcoinEthereumNews2025/09/18 02:28
Evernorth’s XRP Losses Signal Growing Pressures on Crypto Treasury Firms

Evernorth’s XRP Losses Signal Growing Pressures on Crypto Treasury Firms

The post Evernorth’s XRP Losses Signal Growing Pressures on Crypto Treasury Firms appeared on BitcoinEthereumNews.com. COINOTAG recommends • Exchange signup 💹 Trade with pro tools Fast execution, robust charts, clean risk controls. 👉 Open account → COINOTAG recommends • Exchange signup 🚀 Smooth orders, clear control Advanced order types and market depth in one view. 👉 Create account → COINOTAG recommends • Exchange signup 📈 Clarity in volatile markets Plan entries & exits, manage positions with discipline. 👉 Sign up → COINOTAG recommends • Exchange signup ⚡ Speed, depth, reliability Execute confidently when timing matters. 👉 Open account → COINOTAG recommends • Exchange signup 🧭 A focused workflow for traders Alerts, watchlists, and a repeatable process. 👉 Get started → COINOTAG recommends • Exchange signup ✅ Data‑driven decisions Focus on process—not noise. 👉 Sign up → Evernorth’s XRP investment has resulted in approximately $78 million in unrealized losses amid a month-long cryptocurrency market downturn, highlighting the vulnerabilities of digital asset treasury companies (DATs). This pressure stems from volatile prices affecting altcoins like XRP, impacting firms heavily exposed to such assets. Evernorth acquired significant XRP holdings just before a price drop, leading to substantial unrealized losses. Other DATs, like MicroStrategy, face share declines of over 26% in the past month due to Bitcoin’s retreat. BitMine reports nearly $2.1 billion in unrealized losses on Ethereum reserves, with 3.4 million ETH held, including 565,000 acquired recently. Discover how Evernorth’s XRP losses signal rising pressure on digital asset treasury companies amid crypto volatility. Explore DAT challenges and strategies for resilience. Stay informed on market impacts today. What Are Evernorth’s XRP Investment Losses and Their Impact? Evernorth’s XRP investment losses currently stand at around $78 million in unrealized terms, triggered by a sharp decline in XRP’s price following the company’s recent large-scale acquisitions. This situation underscores the risks for digital asset treasury companies (DATs) that allocate significant portions of their…
Share
BitcoinEthereumNews2025/11/08 11:15