Highlights: The BNB price is down 2% to $1111.46, despite the trading volume spiking 26%. The BNB on-chain demand has slipped, with the open interest plummeting 3% showing a drop in demand.  The technical outlook shows a tight tug-of-war, with the bulls attempting to overcome resistance zones.  The BNB price is down 2% today, to trade at $1111.46. Despite the plunge, the daily trading volume has soared 26% showing increased market activity among traders. However, BNB Chain has seen declining network activity, with the open interest plummeting, signaling a drop in demand.  On Chain Demand on BNB Cools Off The BNB Chain is in a state of cooldown of network activity, which indicates low on-chain demand. In most instances, when a network fails to ensure large volumes or revenues, it means that there is low demand or outflows to other networks.  BNB DeFi Data: DeFiLlama According to DeFiLlama data, the volume of the Decentralized Exchanges (DEXs) is down to at least $2.12 billion in comparison to the high of $6.313 billion on October 8, which also means low on-chain liquidity.  On the other hand, Coinglass data shows that the volume of BNB has grown by 3.97% to reach $4.95 billion. However, the open interest in BNB futures has dropped by 3.36% to reach $1.74 billion. This reduction in open interest is an indication of a conservative stance by investors since the number of new positions being opened is low. This could be an indication that investors are not so sure about the short-term price outlook. BNB Derivatives Data: CoinGlass Meanwhile, the long-to-short ratio is sitting at 0.9091. This shows that the traders are undecided on BNB price’s next move, as it sits below 1.  BNB Price Moves Into Consolidation The chart displays the BNB/USD price action on a 4-hour timeframe, with the token currently hovering around $1111.46. The 50-day Simple Moving Average (SMA) is at $1113, while the 200-day SMA sits at $1129, cushioning the bulls against upside movement. The price has mostly been trending below both SMAs, indicating that the bears are having the upper hand.  The BNB trading volume is up, soaring 26%, signaling the momentum is real. On the 4-hour chart, BNB is trading within a consolidation channel. In such a case, this pattern may act as an accumulation period, giving the bulls hind wings to break above resistance zones.  BNB/USD 4-hour chart: TradingView Zooming in, the Relative Strength Index (RSI) sits at 44.15, below the 50 level. This shows weakening momentum in the BNB market, and might lead to the RSI plunging to the oversold region if the bulls don’t regain control. In the short term, the BNB price could move up to $1113 resistance and flip it into support. A close above this zone will see the bulls target $1126 resistance, giving the bulls strength to reclaim the $1230 mark.  Conversely, if the resistance zones prove too strong, a dip towards $1012 could be plausible. In such a case, this could be a prime buy zone for the risk-takers. In the long term, if the token keeps the hype alive, the bulls may reclaim the $1375 high or higher. eToro Platform Best Crypto Exchange Over 90 top cryptos to trade Regulated by top-tier entities User-friendly trading app 30+ million users 9.9 Visit eToro eToro is a multi-asset investment platform. The value of your investments may go up or down. Your capital is at risk. Don’t invest unless you’re prepared to lose all the money you invest. This is a high-risk investment, and you should not expect to be protected if something goes wrong. Highlights: The BNB price is down 2% to $1111.46, despite the trading volume spiking 26%. The BNB on-chain demand has slipped, with the open interest plummeting 3% showing a drop in demand.  The technical outlook shows a tight tug-of-war, with the bulls attempting to overcome resistance zones.  The BNB price is down 2% today, to trade at $1111.46. Despite the plunge, the daily trading volume has soared 26% showing increased market activity among traders. However, BNB Chain has seen declining network activity, with the open interest plummeting, signaling a drop in demand.  On Chain Demand on BNB Cools Off The BNB Chain is in a state of cooldown of network activity, which indicates low on-chain demand. In most instances, when a network fails to ensure large volumes or revenues, it means that there is low demand or outflows to other networks.  BNB DeFi Data: DeFiLlama According to DeFiLlama data, the volume of the Decentralized Exchanges (DEXs) is down to at least $2.12 billion in comparison to the high of $6.313 billion on October 8, which also means low on-chain liquidity.  On the other hand, Coinglass data shows that the volume of BNB has grown by 3.97% to reach $4.95 billion. However, the open interest in BNB futures has dropped by 3.36% to reach $1.74 billion. This reduction in open interest is an indication of a conservative stance by investors since the number of new positions being opened is low. This could be an indication that investors are not so sure about the short-term price outlook. BNB Derivatives Data: CoinGlass Meanwhile, the long-to-short ratio is sitting at 0.9091. This shows that the traders are undecided on BNB price’s next move, as it sits below 1.  BNB Price Moves Into Consolidation The chart displays the BNB/USD price action on a 4-hour timeframe, with the token currently hovering around $1111.46. The 50-day Simple Moving Average (SMA) is at $1113, while the 200-day SMA sits at $1129, cushioning the bulls against upside movement. The price has mostly been trending below both SMAs, indicating that the bears are having the upper hand.  The BNB trading volume is up, soaring 26%, signaling the momentum is real. On the 4-hour chart, BNB is trading within a consolidation channel. In such a case, this pattern may act as an accumulation period, giving the bulls hind wings to break above resistance zones.  BNB/USD 4-hour chart: TradingView Zooming in, the Relative Strength Index (RSI) sits at 44.15, below the 50 level. This shows weakening momentum in the BNB market, and might lead to the RSI plunging to the oversold region if the bulls don’t regain control. In the short term, the BNB price could move up to $1113 resistance and flip it into support. A close above this zone will see the bulls target $1126 resistance, giving the bulls strength to reclaim the $1230 mark.  Conversely, if the resistance zones prove too strong, a dip towards $1012 could be plausible. In such a case, this could be a prime buy zone for the risk-takers. In the long term, if the token keeps the hype alive, the bulls may reclaim the $1375 high or higher. eToro Platform Best Crypto Exchange Over 90 top cryptos to trade Regulated by top-tier entities User-friendly trading app 30+ million users 9.9 Visit eToro eToro is a multi-asset investment platform. The value of your investments may go up or down. Your capital is at risk. Don’t invest unless you’re prepared to lose all the money you invest. This is a high-risk investment, and you should not expect to be protected if something goes wrong.

BNB Price Drops 2% as the Dex Volume Tumbles Cautioning Further Downside

2025/10/29 20:19

Highlights:

  • The BNB price is down 2% to $1111.46, despite the trading volume spiking 26%.
  • The BNB on-chain demand has slipped, with the open interest plummeting 3% showing a drop in demand. 
  • The technical outlook shows a tight tug-of-war, with the bulls attempting to overcome resistance zones. 

The BNB price is down 2% today, to trade at $1111.46. Despite the plunge, the daily trading volume has soared 26% showing increased market activity among traders. However, BNB Chain has seen declining network activity, with the open interest plummeting, signaling a drop in demand. 

On Chain Demand on BNB Cools Off

The BNB Chain is in a state of cooldown of network activity, which indicates low on-chain demand. In most instances, when a network fails to ensure large volumes or revenues, it means that there is low demand or outflows to other networks. 
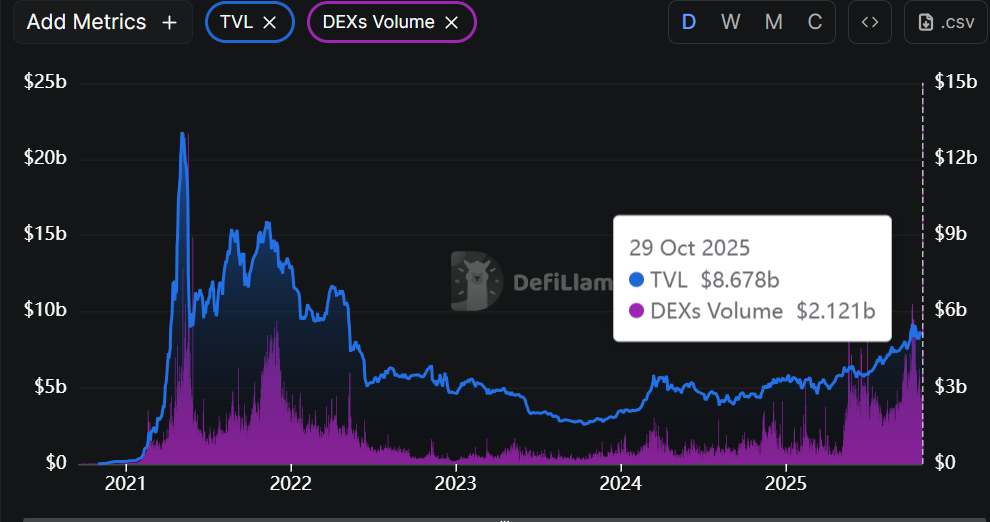
BNB DeFi Data: DeFiLlama

According to DeFiLlama data, the volume of the Decentralized Exchanges (DEXs) is down to at least $2.12 billion in comparison to the high of $6.313 billion on October 8, which also means low on-chain liquidity. 

On the other hand, Coinglass data shows that the volume of BNB has grown by 3.97% to reach $4.95 billion. However, the open interest in BNB futures has dropped by 3.36% to reach $1.74 billion. This reduction in open interest is an indication of a conservative stance by investors since the number of new positions being opened is low. This could be an indication that investors are not so sure about the short-term price outlook.

BNB Derivatives Data: CoinGlass

Meanwhile, the long-to-short ratio is sitting at 0.9091. This shows that the traders are undecided on BNB price’s next move, as it sits below 1. 

BNB Price Moves Into Consolidation

The chart displays the BNB/USD price action on a 4-hour timeframe, with the token currently hovering around $1111.46. The 50-day Simple Moving Average (SMA) is at $1113, while the 200-day SMA sits at $1129, cushioning the bulls against upside movement. The price has mostly been trending below both SMAs, indicating that the bears are having the upper hand. 

The BNB trading volume is up, soaring 26%, signaling the momentum is real. On the 4-hour chart, BNB is trading within a consolidation channel. In such a case, this pattern may act as an accumulation period, giving the bulls hind wings to break above resistance zones. 
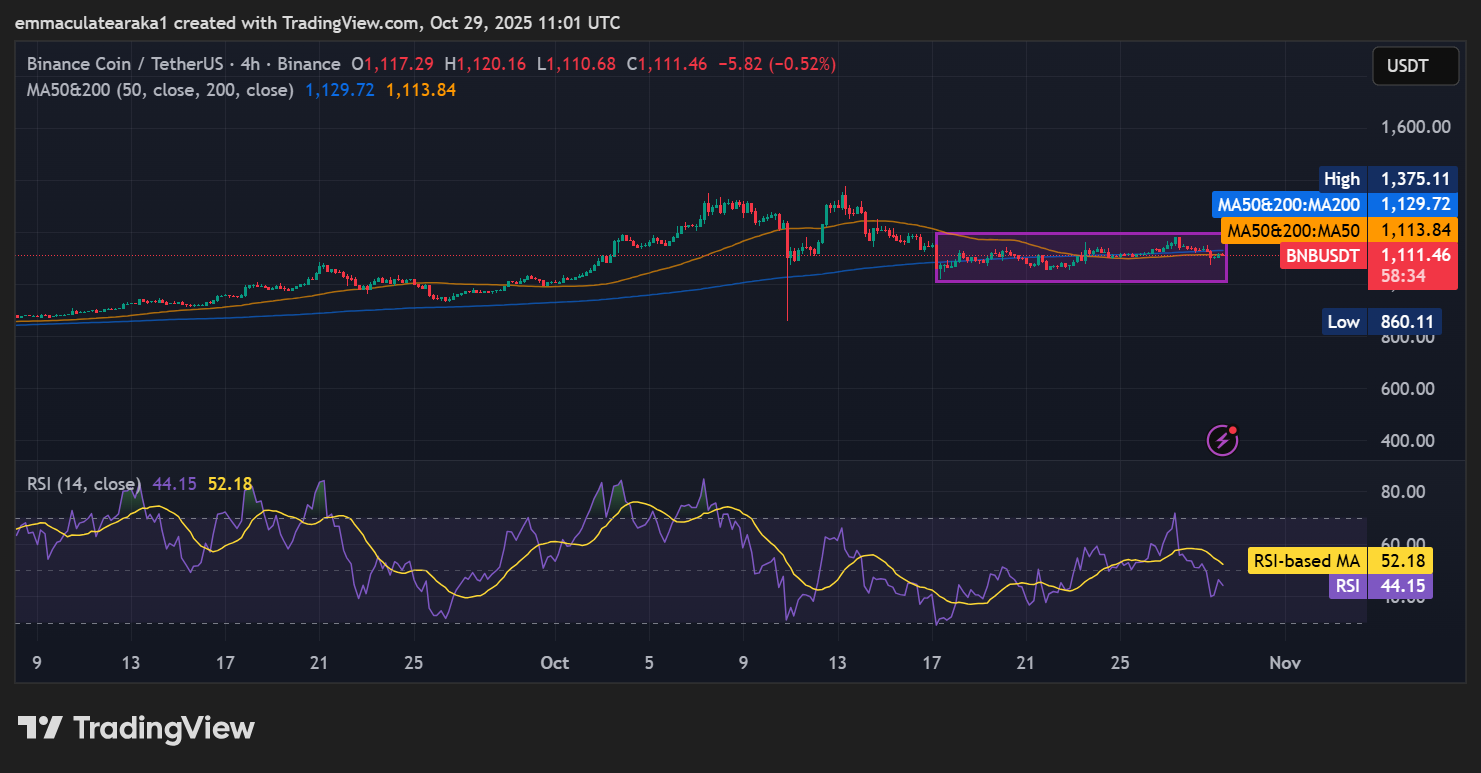
BNB PriceBNB/USD 4-hour chart: TradingView

Zooming in, the Relative Strength Index (RSI) sits at 44.15, below the 50 level. This shows weakening momentum in the BNB market, and might lead to the RSI plunging to the oversold region if the bulls don’t regain control. In the short term, the BNB price could move up to $1113 resistance and flip it into support. A close above this zone will see the bulls target $1126 resistance, giving the bulls strength to reclaim the $1230 mark. 

Conversely, if the resistance zones prove too strong, a dip towards $1012 could be plausible. In such a case, this could be a prime buy zone for the risk-takers. In the long term, if the token keeps the hype alive, the bulls may reclaim the $1375 high or higher.

eToro Platform

Best Crypto Exchange

  • Over 90 top cryptos to trade
  • Regulated by top-tier entities
  • User-friendly trading app
  • 30+ million users
9.9
Visit eToro

eToro is a multi-asset investment platform. The value of your investments may go up or down. Your capital is at risk. Don’t invest unless you’re prepared to lose all the money you invest. This is a high-risk investment, and you should not expect to be protected if something goes wrong.

Disclaimer: The articles reposted on this site are sourced from public platforms and are provided for informational purposes only. They do not necessarily reflect the views of MEXC. All rights remain with the original authors. If you believe any content infringes on third-party rights, please contact service@support.mexc.com for removal. MEXC makes no guarantees regarding the accuracy, completeness, or timeliness of the content and is not responsible for any actions taken based on the information provided. The content does not constitute financial, legal, or other professional advice, nor should it be considered a recommendation or endorsement by MEXC.
Share Insights

You May Also Like

Ethereum Set to Debut ‘Key to Layer-2 Scaling’ as Fusaka Upgrade Clears Final Test

Ethereum Set to Debut ‘Key to Layer-2 Scaling’ as Fusaka Upgrade Clears Final Test

The post Ethereum Set to Debut ‘Key to Layer-2 Scaling’ as Fusaka Upgrade Clears Final Test appeared on BitcoinEthereumNews.com. In brief Ethereum’s Fusaka upgrade has passed its final testnet and is set to launch on the mainnet around December 3. The update will lower transaction costs and improve efficiency by expanding blob storage and implementing PeerDAS, which boosts layer-2 scalability. Developers have said the change could increase blob space by over 400%, marking a major step toward faster, cheaper Ethereum transactions. Ethereum’s latest overhaul is all systems go for deployment.  The network’s upcoming Fusaka upgrade successfully went live on a third and final testnet Tuesday afternoon—meaning it is now greenlit to go live on the Ethereum mainnet in just a few weeks.  Fusaka had previously deployed successfully on the Holesky and Sepolia testnets earlier this month, before going live on the Hoodi network today. It is currently penciled in to debut on the Ethereum mainnet on or around December 3.  Ethereum’s next major upgrade, Fusaka, is now live on the Hoodi network! ✅ Fusaka mainnet activation is scheduled for December 3rd. Fusaka introduces multiple EIPs to improve scalability, strengthen security, and reduce costs. The upgrade will unlock the next phase of rollup… pic.twitter.com/VQkosIouZQ — Consensys.eth (@Consensys) October 28, 2025 The software update seeks to cut transaction costs on Ethereum and boost the network’s efficiency by further streamlining the process by which it samples and verifies data from layer-2 networks. It also includes multiple proposals designed to improve Ethereum’s user experience. These improvements build on innovations introduced in prior Ethereum updates. The network’s 2024 Dencun upgrade introduced blobs, which significantly lowered layer-2 network gas fees by allowing data from such chains to be stored temporarily, as opposed to permanently. Fusaka will dramatically increase the amount of space reserved on every Ethereum transaction block for blobs, thereby making the innovation even more impactful. Marius van der Wijden, an Ethereum core developer,…
Share
BitcoinEthereumNews2025/10/30 09:34