

ELK, Loki, and Graylog Were Overkill, So I built Log Bull
For about five years, I have faced the task of collecting logs, typically from small to medium-sized codebases. Sending logs from code is not a problem: Java and Go have libraries for this practically out of the box. But deploying something to collect them is a headache. I understand that it's a solvable task (even before ChatGPT, and now even more so). Still, all logging systems are primarily geared toward the large enterprise world and its requirements, ~~r~~ather than small teams or single developers with a few sticks, glue, and a “yesterday” deadline.
Launching ELK is a challenge for me every time: a bunch of settings, a non-trivial deployment, and when I enter the UI, my eyes run wild from the tabs. With Loki and Graylog, it's a little easier, but there are still way more features than I need. At the same time, separating logs between projects and adding other users to the system so that they don't see anything they shouldn't, is not the most obvious process either.
So about a year ago, I decided to make my own log collection system. One that is as easy to use and launch as possible. It would be deployed on the server with a single command, without any configuration or unnecessary tabs in the interface. That's how Log Bull came about, and now it's open source: a log collection system for developers with mid-sized projects.
Table of contents:
- About the project
- How to deploy Log Bull?
- How to send logs?
- How to view logs?
- Conclusion
About the project
Log Bull is a log collection system with an emphasis on ease of use (minimal configuration, minimal features, zero-config at startup). The project is completely open source under the Apache 2.0 license. My main priority was to create a solution that would allow a junior developer to easily figure out how to start the system, how to send logs to it, and how to view them in about 15 minutes.

Key features of the project:
- Deployed with a single command via a .sh script or a Docker command.
- You can create multiple isolated projects for collecting logs (and add users to them).
- Extremely simple interface with minimal configuration, and no configuration required at all when starting (zero-config).
- Libraries for Python, Java, Go, JavaScript (TS \ NodeJS), PHP, C#. Rust and Ruby are planned.
- Free, open source and self-hosted.
- No need to know LogQL, Kibana DSL or other query languages to search logs.
https://www.youtube.com/watch?v=8H8jF8nVzJE&embedable=true
The project is developed in Go and built on OpenSearch.
Project website - https://logbull.com
Project GitHub - https://github.com/logbull/logbull
P.S. If you find the project useful and have a GitHub account, please give it a star ⭐️. The first stars are hard to collect. I would be extremely grateful for your support!
How to deploy Log Bull?
There are three ways to deploy a project: via a .sh script (which I recommend), via Docker and via Docker Compose.
Method 1: Installation via script
The script will install Docker, place the project in the /opt/logbull folder, and configure autostart when the system is restarted. Installation command:
sudo apt-get install -y curl && \ sudo curl -sSL https://raw.githubusercontent.com/logbull/logbull/main/install-logbull.sh \ | sudo bash Method 2: Launch via Docker Compose
Create file docker-compose.yml with the following content:
services: logbull: container_name: logbull image: logbull/logbull:latest ports: - "4005:4005" volumes: - ./logbull-data:/logbull-data restart: unless-stopped healthcheck: test: ["CMD", "curl", "-f", "http://localhost:4005/api/v1/system/health"] interval: 5s timeout: 5s retries: 30 And run the command docker compose up -d. The system will start on port 4005.
Method 3: Launch via Docker command
Run the following command in the terminal (the system will also start on port 4005):
docker run -d \ --name logbull \ -p 4005:4005 \ -v ./logbull-data:/logbull-data \ --restart unless-stopped \ --health-cmd="curl -f http://localhost:4005/api/v1/system/health || exit 1" \ --health-interval=5s \ --health-retries=30 \ logbull/logbull:latest How to send logs?
I designed the project with convenience in mind, primarily for developers. That's why I created libraries for most popular development languages. I did this with the idea that Log Bull can be connected to any popular library as a processor without changing the current code base.
I highly recommend checking out the examples on the website, because there is an interactive panel for selecting a language:
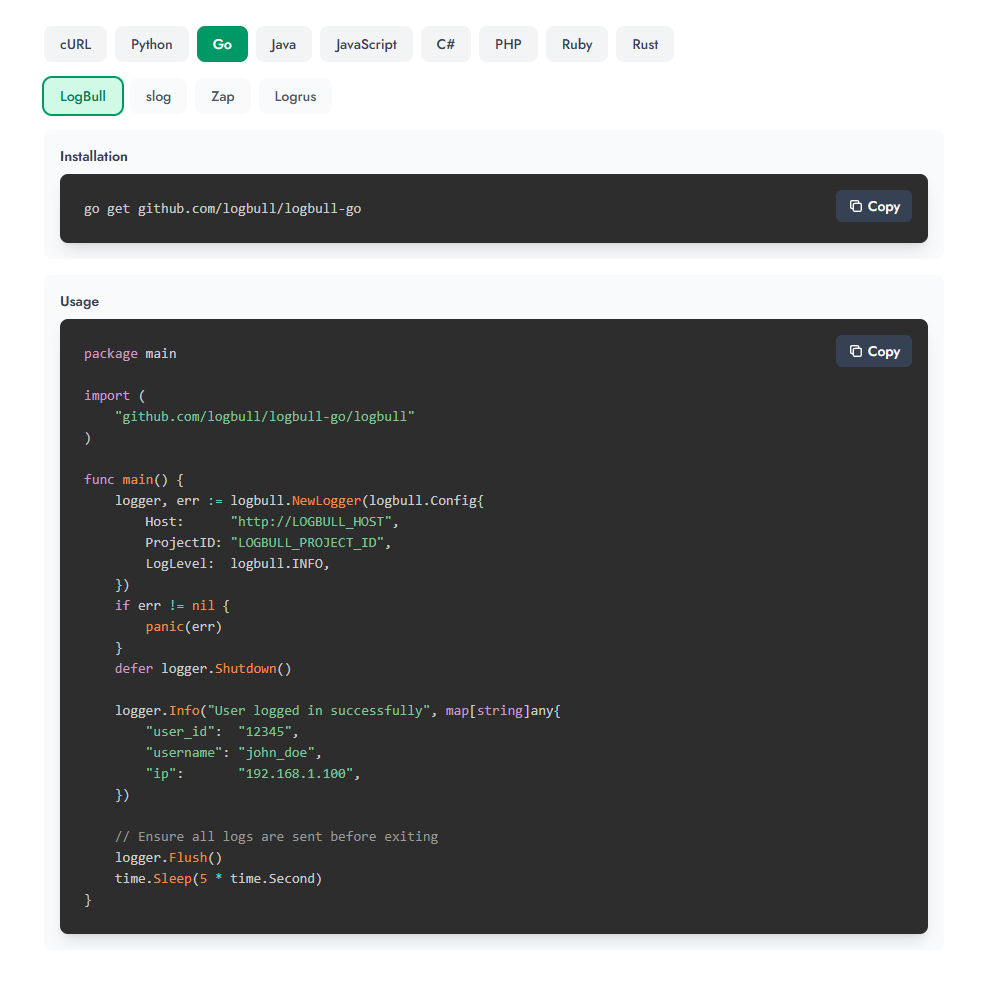
Let's take Python as an example. First, you need to install the library (although you can also send it via HTTP; there are examples for cURL):
pip install logbull Then send from code:
import time from logbull import LogBullLogger # Initialize logger logger = LogBullLogger( host="http://LOGBULL_HOST", project_id="LOGBULL_PROJECT_ID", ) # Log messages (printed to console AND sent to LogBull) logger.info("User logged in successfully", fields={ "user_id": "12345", "username": "john_doe", "ip": "192.168.1.100" }) # With context session_logger = logger.with_context({ "session_id": "sess_abc123", "user_id": "user_456" }) session_logger.info("Processing request", fields={ "action": "purchase" }) # Ensure all logs are sent before exiting logger.flush() time.sleep(5) How to view logs?
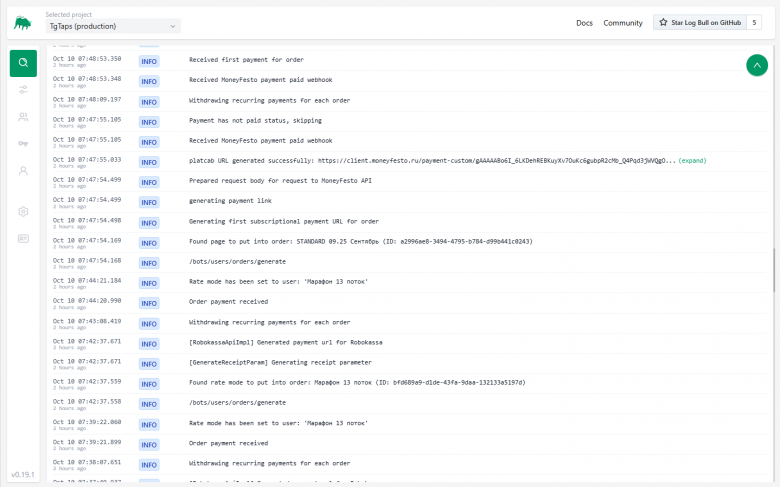
All logs are displayed immediately on the main screen. You can:
-
Reduce the size of messages (by cutting the line to ~50-100 characters).
-
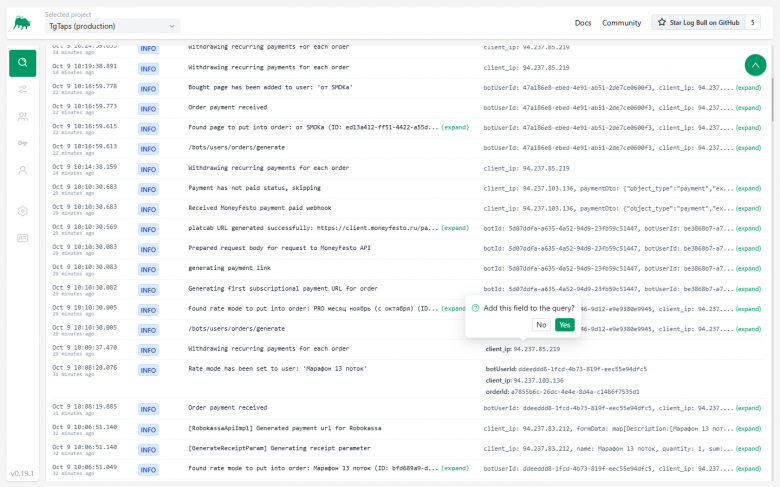
Expand the list of sent fields (userid, orderid, etc.).
-
Click on a field and add it to the filter. Logs search with conditions:
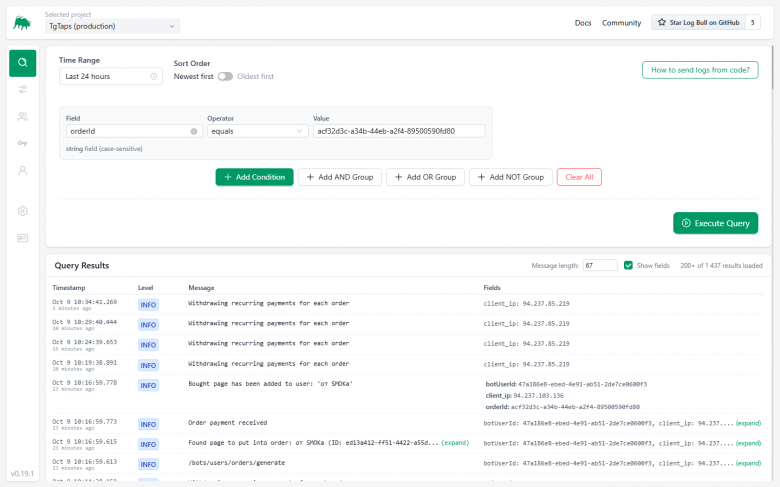
You can also collect groups of conditions (for example, the message includes certain text, but excludes a specific server IP address).
Conclusion
I hope my log collection system will be useful to those developers who do not want or cannot (due to limited project resources) implement “heavyweight” solutions such as ELK. I am already using Log Bull in production projects, and everything is going well. I welcome feedback, suggestions for improvement, and issues on GitHub.
You May Also Like

Privacy Coins Rally Driven by Technicals, Narrative

‘Survival Mode’ Activated: Bitcoin Miners Struggle As Hashprice Collapses
