AIOps (Artificial Intelligence for IT Operations) is stepping up. Inlayman's terms, automated event correlation and machine learning drive operations not just to respond quicker but also to predict and remediate proactively.AIOps (Artificial Intelligence for IT Operations) is stepping up. Inlayman's terms, automated event correlation and machine learning drive operations not just to respond quicker but also to predict and remediate proactively.

Going From Reactive to Predictive Incident Response with AIOps

2025/11/05 05:30

For a long time, the traditional incident-response model has been used to deal with crises, ranging from cybersecurity attacks to hardware and network failures. But times have changed, and we are now in a dynamic environment that has multi- and hybrid clouds with continuous-deploy pipelines. Those traditional models no longer work.

Today, systems generate countless events and thousands of metrics in a single sector. No wonder the reactive stance just doesn’t work anymore.

Well, the good news is that AIOps (Artificial Intelligence for IT Operations) is stepping up. In layman's terms, automated event correlation and machine learning drive operations not just to respond quicker but also to predict and remediate proactively. So, the future of incident response is going to be less about “we got another pager, let’s fix it” and more about “the user never notices because we anticipate and automatically act.”

1. Why Does Current Incident Response Fall Short?

\ Figure 1. 2024 Annual Survey of Cloud Native Computing Foundation (CNCF) Reveals that Kubernetes Was Used by 85% of Firms

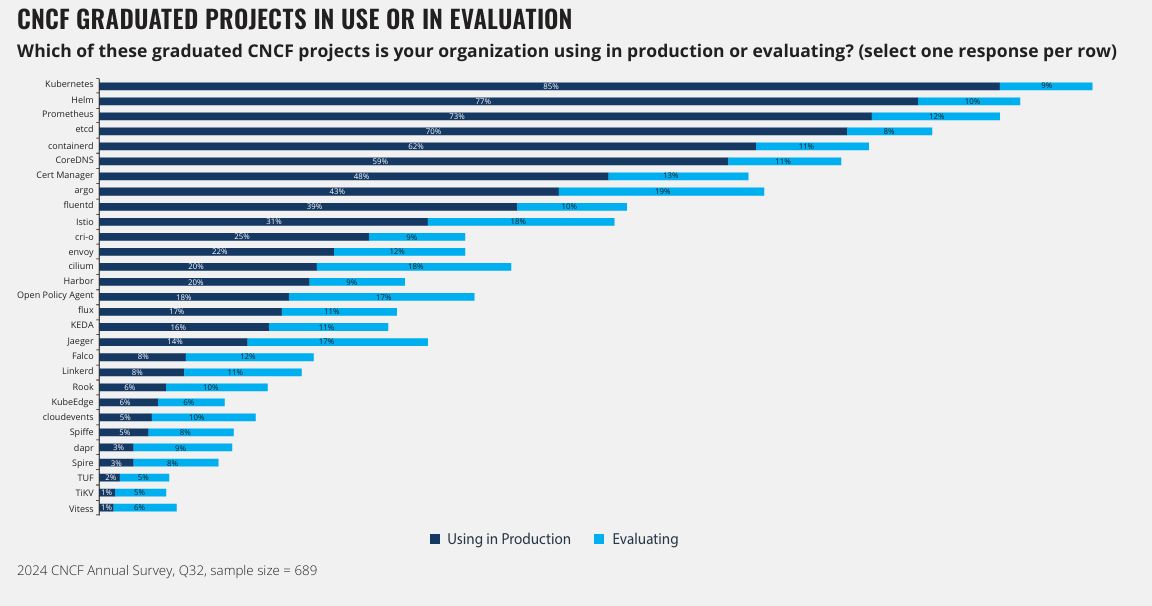
Before I talk about AIOps, it’s only fair to discuss the current shortfalls of traditional incident response. First of all, modern architecture has changed dramatically*.* We now run hundreds or even thousands of container-based services in multi-cloud and hybrid-cloud environments with changing topologies. For instance, CNCF (Cloud Native Computing Foundation) indicated in its 2024 survey that Kubernetes was used by 85% of firms in production (see Figure 1).

Additionally, 100-150 gigabytes (GB) of data per indexer is being ingested by enterprises daily, which collectively overwhelms legacy workflows.

Simply put, with multiple cloud environments and thousands of microservices, human processes cannot manage the size and velocity of operational data it generates. Second, the manual incident workflow is time-consuming. For instance, consider the steps: alert triggers a page → engineer logs in → inspects dashboards and traces → creates hypothesis → remediates everything manually. This increases Mean Time to Detect (MTTD) and Mean Time to Resolve (MTTR) of incidents for the operations team.

A study done by Pager Duty highlights that the average time it takes to manage an incident across 500 IT organizations is about 175 minutes, and it results in a downtime cost of about $4,500 per minute. So, obviously, this adds significant costs besides affecting customer experience. Moreover, in traditional incident responses, there is a lot of alert fatigue. For example, more than 10,000 alerts are processed daily by large organizations, and most of them are duplicates or false positives. DropZone study confirms that 66% of SOC teams cannot keep up with the pace of alerts. Additionally, 25-30% of alerts are even overlooked because of this overload.

2. Predictive Incident Response and AIOps in Practice

Sure, the current model for incident response is ineffective, but what about this predictive model? What do AIOps have for predictive incident responses? Let me explain by dividing it into three parts:

2.1 Machine Learning Based Observability and Anomaly Detection

At the very center of modern incident response is machine learning that is applied to observability data. This involves topology, events, traces, and even logs. This data is ingested into AIOps platforms and correlated across sources before possible anomalies and their root causes are identified. This is what helps with proactive actions.

There are multiple AIOps platforms that offer “Predictive Alerts.” Teams can use this feature to fit time-series models on historical metrics and predict future values (the next 360 observations). It will trigger an alert if a specific threshold may be breached in the future.

\

2.2 Policy-as-Code and Self-Healing Pipelines

It is surprising to learn that Site Reliability Engineering (SRE) teams are codifying their remediation and reliability policies as executable codes. For instance, Service Level Objectives (SLOs) and roll-back rules are defined, and when they are combined with an AIOps engine that found a risk, the system can remediate automatically. For example, it can roll back a canary deployment that is seen as risky or even scale up a microservice prior to a forecasted increase.

Moreover, in a platform like Kubernetes, this can be implemented using custom operators that can monitor reliability metrics and perform actions. For example: traffic routing by an operator when a threshold is breached for an error-budget rate. In academic studies, many authors like Zota et al. (2025) see autonomous agents as carrying out end-to-end operations across incident lifecycles.

2.3 SLO Led Automation and Error-Budget Enforcement

Many organizations now have SLOs, and error budgets (EB) integrated into their real-time operations, not just in dashboards. When an upcoming SLO breach is predicted by an AIOps engine, mitigations can be started automatically by the system. For instance, it can spin up additional resources or pause a rollout. This will save a lot of hassle in terms of decision-making and manual work.

In the industry, open-source stacks such as Prometheus for collecting metrics and Grafana for dashboards are commonly used. In fact, they form the base of ingestion for machine learning (ML) pipelines. Data collected by Prometheus becomes the input for ML models, which is assessed to find patterns and forecast future incidents. Meanwhile, these predictions are visualized by Grafana.

2.4 Benefits of Predictive Incident Response

So, what would happen if businesses switched to predictive and automated incident responses?

Both MTTD and MTTR will decrease significantly. When anomaly detection and automation are combined, detection becomes quicker. Research done by Purushotham Reddy (2021) on the AWS platform confirms that predefined playbooks and automation decreased MTTD by 62% and MTTR by 51%. This means a decrease from 97 minutes to 37 minutes in MTTD and 4.3 hours to 2.1 hours in MTTR. The main benefit is clear: firms experience less downtime and less revenue loss due to faster recovery.

Another benefit is that the operational toil has decreased. By automating incident categorization and alert correlation, DevOps engineers and SREs can focus on proactive work. An article on CNBC confirms that AIOps can reduce burnout, which means happier teams and less turnover.

The key benefits that integration of AIOps into operations provides are reduced downtime, improved availability, and stability of the systems. There are many factors contributing to this; such as scaling services proactively before a forecasted load increase and routing traffic during performance degradation, resulting in fewer incidents and better availability. This availability improvement directly enhances customer experience as they do not have to wait and can seamlessly carry out their interactions without any disruptions.

3. Architecture Flowchart

Figure 2 shows an architecture flowchart for predictive incident response in an AIOps environment:

4. Implementation Considerations and Best Practices

AIOps provides significant benefits in predictive operations. However, there are trade-offs to consider. Here are key best practices:

4.1 Data Quality and Ingestion

Many organizations fail to recognize the importance of telemetry, even though everything from models to automation relies on high-quality and timely data. That is why it is important for companies to invest in pipelines that can ingest change events, metrics, logs, traces, labels to enrich them. Motadata reports that over 65% of failures in AIOps are caused by poor ingestion of data.

Therefore, the best practice is to begin with smaller domains, such as a key service where data is manageable. After cleaning the data, build models and then expand as you deem right.

4.2 Phased Adoption

There is no need to target a “full self-heading system.” Many firms succeed in using a phased approach. So, instead, focus on three key phases:

  1. Improving visibility and triage automation, such as reducing alert noise and correlating events.
  2. Enabling automatic diagnosis and recommendations through machine learning.

Allowing self-healing and continuous learning through agents.

As per the industry standard, it takes about 12-18 months to move from Phase 1 to Phase 3, so focus on building trust along the way.

4.3 Governance and Explainability

Many organizations make the mistake of removing human governance altogether from an AIOps system. Until trust is built, keep humans in the loop. After all, model transparency and clear Service Level Agreements (SLAs) for automation of decisions are important. A best practice is to document the reasons for remediation and enable engineers to feed results back into the system for retraining.

4.4 Skills and Metrics

Reliability engineering teams need to evolve from traditional SRE skills and develop expertise in DevOps tooling and automation. Businesses must create a culture to improve training and cross-functional collaboration. A best practice is to invest in training and create cross-functional teams to ensure shared understanding.

Track the key metrics, including MTTD, MTTR, alert volume, reduced toil hours, and cost of downtime before and after the implementation of AIOps to see the value.

Conclusion

The shift from reactive incident response to self-healing operations is now essential for businesses. Modern systems are too complex to be managed by legacy workflows. Therefore, firms need to adopt a mindset of “we prevented it from breaking” by investing in telemetry, applying machine learning and automation, and ensuring a culture of continuous improvement.

Disclaimer: The articles reposted on this site are sourced from public platforms and are provided for informational purposes only. They do not necessarily reflect the views of MEXC. All rights remain with the original authors. If you believe any content infringes on third-party rights, please contact service@support.mexc.com for removal. MEXC makes no guarantees regarding the accuracy, completeness, or timeliness of the content and is not responsible for any actions taken based on the information provided. The content does not constitute financial, legal, or other professional advice, nor should it be considered a recommendation or endorsement by MEXC.
Share Insights

You May Also Like

Ethereum unveils roadmap focusing on scaling, interoperability, and security at Japan Dev Conference

Ethereum unveils roadmap focusing on scaling, interoperability, and security at Japan Dev Conference

The post Ethereum unveils roadmap focusing on scaling, interoperability, and security at Japan Dev Conference appeared on BitcoinEthereumNews.com. Key Takeaways Ethereum’s new roadmap was presented by Vitalik Buterin at the Japan Dev Conference. Short-term priorities include Layer 1 scaling and raising gas limits to enhance transaction throughput. Vitalik Buterin presented Ethereum’s development roadmap at the Japan Dev Conference today, outlining the blockchain platform’s priorities across multiple timeframes. The short-term goals focus on scaling solutions and increasing Layer 1 gas limits to improve transaction capacity. Mid-term objectives target enhanced cross-Layer 2 interoperability and faster network responsiveness to create a more seamless user experience across different scaling solutions. The long-term vision emphasizes building a secure, simple, quantum-resistant, and formally verified minimalist Ethereum network. This approach aims to future-proof the platform against emerging technological threats while maintaining its core functionality. The roadmap presentation comes as Ethereum continues to compete with other blockchain platforms for market share in the smart contract and decentralized application space. Source: https://cryptobriefing.com/ethereum-roadmap-scaling-interoperability-security-japan/
Share
BitcoinEthereumNews2025/09/18 00:25
Understanding Bitcoin Mining Through the Lens of Dutch Disease

Understanding Bitcoin Mining Through the Lens of Dutch Disease

There’s a paradox at the heart of modern economics: sometimes, discovering a valuable resource can make a country poorer. It sounds impossible — how can sudden wealth lead to economic decline? Yet this pattern has repeated across decades and continents, from the Netherlands’ natural gas boom in the 1960s to oil discoveries in numerous developing countries. Economists have a name for this phenomenon: Dutch Disease. Today, as Bitcoin Mining operations establish themselves in regions around the world, attracted by cheap resources. With electricity and favorable regulations, economists are asking an intriguing question: Does cryptocurrency mining share enough characteristics with traditional resource booms to trigger similar economic distortions? Or is this digital industry different enough to avoid the pitfalls that have plagued oil-rich and gas-rich nations? The Kazakhstan Case Study In 2021, Kazakhstan became a global Bitcoin mining hub after China’s cryptocurrency ban. Within months, mining operations consumed nearly 8% of the nation’s electricity. The initial windfall — investment, jobs, tax revenue — quickly turned to crisis. By early 2022, the country faced rolling blackouts, surging energy costs for manufacturers, and public protests. The government imposed strict mining limits, but damage to traditional industries was already done. This pattern has a name: Dutch Disease. Understanding Dutch Disease Dutch Disease describes how sudden resource wealth can paradoxically weaken an economy. The term comes from the Netherlands’ experience after discovering North Sea gas in 1959. Despite the windfall, the Dutch economy suffered as the booming gas sector drove up wages and currency values, making traditional manufacturing uncompetitive. The mechanisms were interconnected: Foreign buyers needed Dutch guilders to purchase gas, strengthening the currency and making Dutch exports expensive. The gas sector bid up wages, forcing manufacturers to raise pay while competing in global markets where they couldn’t pass those costs along. The most talented workers and infrastructure investment flowed to gas extraction rather than diverse economic activities. When gas prices eventually fell in the 1980s, the Netherlands found itself with a hollowed-out industrial base — wealthier in raw terms but economically weaker. The textile factories had closed. Manufacturing expertise had evaporated. The younger generation possessed skills in gas extraction but limited training in other industries. This pattern has repeated globally. Nigeria’s oil discovery devastated its agricultural sector. Venezuela’s resource wealth correlates with chronic economic instability. The phenomenon is so familiar that economists call it the “resource curse” — the observation that countries with abundant natural resources often perform worse economically than countries without them. Bitcoin mining creates similar dynamics. Mining operations are essentially warehouses of specialized computers solving mathematical puzzles to earn bitcoin rewards (currently worth over $200,000 per block) — the catch: massive electricity consumption. A single facility can consume as much power as a small city, creating economic pressures comparable to those of traditional resource booms. How Mining Crowds Out Other Industries Dutch Disease operates through four interconnected channels: Resource Competition: Mining operations consume massive amounts of electricity at preferential rates, leaving less capacity for factories, data centers, and residential users. In constrained power grids, this creates a zero-sum competition in which mining’s profitability directly undermines other industries. Textile manufacturers in El Salvador reported a 40% increase in electricity costs within a year of nearby mining operations — costs that made global competitiveness untenable. Price Inflation: Mining operators bidding aggressively for electricity, real estate, technical labor, and infrastructure drive up input costs across regional economies. Small and medium enterprises operating on thin margins are particularly vulnerable to these shocks. Talent Reallocation: High mining wages draw skilled electricians, engineers, and technicians from traditional sectors. Universities report declining enrollment in manufacturing engineering as students pivot toward cryptocurrency specializations — skills that may prove narrow if mining operations relocate or profitability collapses. Infrastructure Lock-In: Grid capacity, cooling systems, and telecommunications networks optimized for mining rather than diversified development make regions increasingly dependent on a single volatile industry. This specialization makes economic diversification progressively more difficult and expensive. Where Vulnerability Is Highest The risk of mining-induced Dutch Disease depends on several structural factors: Small, undiversified economies face the most significant risk. When mining represents 5–10% of GDP or electricity consumption, it can dominate economic outcomes. El Salvador’s embrace of Bitcoin and Central Asian republics with significant mining operations exemplify this concentration risk. Subsidized energy creates perverse incentives. When governments provide electricity at a loss, mining operations enjoy artificial profitability that attracts excessive investment, intensifying Dutch Disease dynamics. The disconnect between private returns and social costs ensures mining expands beyond economically efficient levels. Weak governance limits effective responses. Without robust monitoring, transparent pricing, or enforceable frameworks, governments struggle to course-correct even when distortions become apparent. Rapid, unplanned growth creates an immediate crisis. When operations scale faster than infrastructure can accommodate, the result is blackouts, equipment damage, and cascading economic disruptions. Why Bitcoin Mining Differs from Traditional Resource Curses Several distinctions suggest mining-induced distortions may be more manageable than historical resource curses: Operational Mobility: Unlike oil fields, mining facilities can relocate relatively quickly. When China banned mining in 2021, operators moved to Kazakhstan, the U.S., and elsewhere within months. This mobility creates different dynamics — governments have leverage through regulation and pricing, but also face competition. The threat of exit disciplines both miners and regulators, potentially yielding more efficient outcomes than traditional resource sectors, where geographic necessity reduces flexibility. No Currency Appreciation: Classical Dutch Disease devastated manufacturing due to currency appreciation. Bitcoin mining doesn’t trigger this mechanism — mining revenues are traded globally and typically converted offshore, avoiding the local currency effects that made Dutch products uncompetitive in the 1960s. Export-oriented manufacturing can remain price-competitive if direct resource competition and input costs are managed. Profitability Volatility: Mining economics are extraordinarily sensitive to Bitcoin prices, network difficulty, and energy costs. When Bitcoin fell from $65,000 to under $20,000 in 2022, many operations became unprofitable and shut down rapidly. This boom-bust cycle, while disruptive, prevents the permanent structural transformation characterizing oil-dependent economies. Resources get released back to the broader economy during busts. Repurposable Infrastructure: Mining facilities can be repurposed as regular data centers. Electrical infrastructure serves other industrial uses. Telecommunications upgrades benefit diverse businesses. Unlike exhausted oil fields requiring environmental cleanup, mining infrastructure can support cloud computing, AI research, or other digital economy activities — creating potential for positive spillovers. Managing the Risk: Three Approaches Bitcoin stakeholders and host regions should consider three strategies to capture benefits while mitigating Dutch Disease risks: Dynamic Energy Pricing: Moving from fixed, subsidized rates toward pricing that reflects actual resource scarcity and opportunity costs. Iceland and Nordic countries have implemented time-of-use pricing and interruptible contracts that allow mining during off-peak periods while preserving capacity for critical uses during demand surges. Transparent, rule-based pricing formulas that adjust for baseline generation costs, grid congestion during peak periods, and environmental externalities let mining flourish when economically appropriate while automatically constraining it during resource competition. The challenge is political — subsidized electricity often exists for good reasons, including supporting industrial development and helping low-income residents. But allowing below-cost electricity to attract mining operations that may harm more than help represents a false economy. Different jurisdictions are finding different balances: some embrace market-based pricing, others maintain subsidies while restricting mining access, and some ban mining outright. Concentration Limits: Formal constraints on mining’s share of regional electricity and economic activity can prevent dominance. Norway has experimented with caps limiting mining to specific percentages of regional power capacity. The logic is straightforward: if mining represents 10–15% of electricity use, it’s significant but doesn’t dominate. If it reaches 40–50%, Dutch Disease risks become severe. These caps create certainty for all stakeholders. Miners understand expansion parameters. Other industries know they won’t be entirely squeezed out. Grid operators can plan with more explicit constraints. The challenge lies in determining appropriate thresholds — too low forgoes legitimate opportunity, too high fails to prevent problems. Smaller, less diversified economies warrant more conservative limits than larger, more robust ones. Multi-Purpose Infrastructure: Rather than specializing exclusively in mining, strategic planning should ensure investments serve broader purposes. Grid expansion benefiting diverse industrial users, telecommunications targeting rural connectivity alongside mining needs, and workforce programs emphasizing transferable skills (data center operations, electrical systems management, cybersecurity) can treat mining as a bridge industry, justifying infrastructure that enables broader digital economy development. Singapore’s evolution from an oil-refining hub to a diversified financial and technology center provides a valuable template: leverage the initial high-value industry to build capabilities that support economic complexity, rather than becoming path-dependent on a single volatile sector. Some regions are applying this thinking to Bitcoin mining — asking what infrastructure serves mining today but could enable cloud computing, AI research, or other digital activities tomorrow. Conclusion The parallels between Bitcoin mining and Dutch Disease are significant: sudden, high-value activity that crowds out traditional industries through resource competition, price inflation, talent reallocation, and infrastructure specialization. Kazakhstan’s 2021–2022 experience demonstrates this pattern can unfold rapidly. Yet essential differences exist. Mining’s mobility, currency neutrality, profitability volatility, and repurposable infrastructure create policy opportunities unavailable to governments confronting traditional resource curses. The question isn’t whether mining causes economic distortion — in some contexts it clearly has — but whether stakeholders will act to channel this activity toward sustainable development. For the Bitcoin community, this means recognizing that long-term industry viability depends on avoiding the resource curse pattern. Regions devastated by boom-bust cycles will ultimately restrict or ban mining regardless of short-term benefits. Sustainable growth requires accepting pricing that reflects actual costs, respecting concentration limits, and contributing to infrastructure that serves broader economic purposes. For host regions, the challenge is capturing mining’s benefits without sacrificing economic diversity. History shows resource booms that seem profitable in the moment often weaken economies in the long run. The key is recognizing risks during the boom — when everything seems positive and there’s pressure to embrace the opportunity uncritically — rather than waiting until damage becomes undeniable. The next decade will determine whether Bitcoin mining becomes a cautionary tale of resource misallocation or a case study in integrating volatile, technology-intensive industries into developing economies without triggering historical pathologies. The outcome depends not on the technology itself, but on whether humans shaping investment and policy decisions learn from history’s repeated lessons about how sudden wealth can become an economic curse. References Canadian economy suffers from ‘Dutch disease’ | Correspondent Frank Kuin. https://frankkuin.com/en/2005/11/03/dutch-disease-canada/ Sovereign Wealth Funds — Angadh Nanjangud. https://angadh.com/sovereignwealthfunds Understanding Bitcoin Mining Through the Lens of Dutch Disease was originally published in Coinmonks on Medium, where people are continuing the conversation by highlighting and responding to this story
Share
Medium2025/11/05 13:53