Author: Michael Nadeau Compiled by: Plain Language Blockchain The post-pandemic era has been defined by fiscal dominance—an economy driven by government deficits and short-term Treasury bond issuance, with liquidity remaining high even as the Federal Reserve maintains high interest rates. Today, we are entering a phase dominated by the private sector, where the Treasury is withdrawing liquidity through tariffs and spending restrictions, unlike the previous administration. That's why interest rates need to fall. We analyze the current cycle from the perspective of global liquidity to emphasize why the current round of "devaluation trading" has reached its final stage. Is fiscal dominance coming to an end? We always hope to "buy the dip" when everyone else is "chasing the rise". That's why all the recent discussions about "devaluation trading" have caught our attention. Data: Google Trends We believe the interest in "devaluation trading" arose a few years ago. At that time, Bitcoin was priced at $25,000 and gold at $2,000. Back then, nobody talked about it except cryptocurrency and macro analysts. In our view, this "deal" is essentially complete. Therefore, our task is to understand the conditions that created it, and whether those conditions will continue to exist. What drove this deal? In our view, there are mainly two factors. 1. Treasury spending. During the Biden administration, we implemented a large-scale fiscal deficit. Data: US Treasury The fiscal year 2025 has just ended, and the deficit has narrowed slightly—primarily due to increased taxes (tariffs) rather than reduced spending. However, the Big Beautiful Bill is expected to achieve spending cuts by reducing benefits from Medicaid and the Supplemental Nutrition Assistance Program (SNAP). Data: Comparison of KFF (Kaiser Family Foundation) cuts with current spending trajectory During Biden's presidency, government spending and transfer payments continuously injected liquidity into the economy. However, under the Great America Act, spending growth slowed. This means that the government is injecting less money into the economy. In addition, the government is withdrawing funds from the economy through tariffs. Data: FRED (St. Louis Federal Reserve Economic Data) The combination of spending restrictions (relative to the previous administration) and increased tariffs means that the Treasury is now absorbing liquidity rather than supplying it. This is why we need to cut interest rates. "We will privatize the economy, revitalize the private sector, and shrink the government." - Scott Bessent 2. "Treasury QE". To fund the excessive spending by the Treasury during the Biden administration, we also saw a new form of "quantitative easing" (QE). We can observe this below (black line). "Treasury QE" supported the market by funding government spending through short-term notes rather than long-term bonds. Data: Global Liquidity Index We believe that fiscal spending and quantitative easing by the Treasury have fueled the “devaluation trade” and “everything bubble” that we have seen in the past few years. But now we are transitioning to a "Trump economy," with the private sector taking over the reins from the Treasury. Similarly, this is why they need to lower interest rates. They need to use bank loans to stimulate the private sector. As we enter this transition period, the global liquidity cycle appears to be peaking... The global liquidity cycle is peaking and declining. Current cycle and average cycle Below, we can observe a comparison between the current cycle (red line) and the historical average cycle (gray line) since 1970. Data: Global Liquidity Index Asset allocation Based on Mr. Howell's work on global liquidity indices, we can observe typical liquidity cycles and their alignment with asset allocation. Commodities are often the last assets to fall, which is exactly what we are seeing today (gold, silver, copper, palladium). From this perspective, the current cycle looks very typical. Data: Global Liquidity Index So, if liquidity is indeed peaking, we expect investors to rotate into cash and bonds as the environment changes. To be clear, this process hasn't even begun yet (the market remains "risk-averse"). Debt and Liquidity According to the Global Liquidity Index, the debt-to-liquidity ratio of major economies reached its lowest level since 1980 at the end of last year. It is now rising and is expected to continue rising until 2026. Data: Global Liquidity Index The rising debt-to-liquidity ratio makes it more difficult to service trillions of dollars of outstanding debt that need to be refinanced. Data: Global Liquidity Index Bitcoin and Global Liquidity Of course, Bitcoin has "foreshadowed" peak global liquidity in the past two cycles. In other words, Bitcoin peaked months before liquidity peaked and began to decline, seemingly anticipating the subsequent drop. Data: Global Liquidity Index We don't know if this is happening right now. But we do know that cryptocurrency cycles always closely follow liquidity cycles. Alignment with the cryptocurrency cycle Data: Global Liquidity IndexAuthor: Michael Nadeau Compiled by: Plain Language Blockchain The post-pandemic era has been defined by fiscal dominance—an economy driven by government deficits and short-term Treasury bond issuance, with liquidity remaining high even as the Federal Reserve maintains high interest rates. Today, we are entering a phase dominated by the private sector, where the Treasury is withdrawing liquidity through tariffs and spending restrictions, unlike the previous administration. That's why interest rates need to fall. We analyze the current cycle from the perspective of global liquidity to emphasize why the current round of "devaluation trading" has reached its final stage. Is fiscal dominance coming to an end? We always hope to "buy the dip" when everyone else is "chasing the rise". That's why all the recent discussions about "devaluation trading" have caught our attention. Data: Google Trends We believe the interest in "devaluation trading" arose a few years ago. At that time, Bitcoin was priced at $25,000 and gold at $2,000. Back then, nobody talked about it except cryptocurrency and macro analysts. In our view, this "deal" is essentially complete. Therefore, our task is to understand the conditions that created it, and whether those conditions will continue to exist. What drove this deal? In our view, there are mainly two factors. 1. Treasury spending. During the Biden administration, we implemented a large-scale fiscal deficit. Data: US Treasury The fiscal year 2025 has just ended, and the deficit has narrowed slightly—primarily due to increased taxes (tariffs) rather than reduced spending. However, the Big Beautiful Bill is expected to achieve spending cuts by reducing benefits from Medicaid and the Supplemental Nutrition Assistance Program (SNAP). Data: Comparison of KFF (Kaiser Family Foundation) cuts with current spending trajectory During Biden's presidency, government spending and transfer payments continuously injected liquidity into the economy. However, under the Great America Act, spending growth slowed. This means that the government is injecting less money into the economy. In addition, the government is withdrawing funds from the economy through tariffs. Data: FRED (St. Louis Federal Reserve Economic Data) The combination of spending restrictions (relative to the previous administration) and increased tariffs means that the Treasury is now absorbing liquidity rather than supplying it. This is why we need to cut interest rates. "We will privatize the economy, revitalize the private sector, and shrink the government." - Scott Bessent 2. "Treasury QE". To fund the excessive spending by the Treasury during the Biden administration, we also saw a new form of "quantitative easing" (QE). We can observe this below (black line). "Treasury QE" supported the market by funding government spending through short-term notes rather than long-term bonds. Data: Global Liquidity Index We believe that fiscal spending and quantitative easing by the Treasury have fueled the “devaluation trade” and “everything bubble” that we have seen in the past few years. But now we are transitioning to a "Trump economy," with the private sector taking over the reins from the Treasury. Similarly, this is why they need to lower interest rates. They need to use bank loans to stimulate the private sector. As we enter this transition period, the global liquidity cycle appears to be peaking... The global liquidity cycle is peaking and declining. Current cycle and average cycle Below, we can observe a comparison between the current cycle (red line) and the historical average cycle (gray line) since 1970. Data: Global Liquidity Index Asset allocation Based on Mr. Howell's work on global liquidity indices, we can observe typical liquidity cycles and their alignment with asset allocation. Commodities are often the last assets to fall, which is exactly what we are seeing today (gold, silver, copper, palladium). From this perspective, the current cycle looks very typical. Data: Global Liquidity Index So, if liquidity is indeed peaking, we expect investors to rotate into cash and bonds as the environment changes. To be clear, this process hasn't even begun yet (the market remains "risk-averse"). Debt and Liquidity According to the Global Liquidity Index, the debt-to-liquidity ratio of major economies reached its lowest level since 1980 at the end of last year. It is now rising and is expected to continue rising until 2026. Data: Global Liquidity Index The rising debt-to-liquidity ratio makes it more difficult to service trillions of dollars of outstanding debt that need to be refinanced. Data: Global Liquidity Index Bitcoin and Global Liquidity Of course, Bitcoin has "foreshadowed" peak global liquidity in the past two cycles. In other words, Bitcoin peaked months before liquidity peaked and began to decline, seemingly anticipating the subsequent drop. Data: Global Liquidity Index We don't know if this is happening right now. But we do know that cryptocurrency cycles always closely follow liquidity cycles. Alignment with the cryptocurrency cycle Data: Global Liquidity Index
Is the global liquidity cycle peaking? Is the Bitcoin bull market over?

2025/11/05 07:00

Author: Michael Nadeau

Compiled by: Plain Language Blockchain

The post-pandemic era has been defined by fiscal dominance—an economy driven by government deficits and short-term Treasury bond issuance, with liquidity remaining high even as the Federal Reserve maintains high interest rates.

Today, we are entering a phase dominated by the private sector, where the Treasury is withdrawing liquidity through tariffs and spending restrictions, unlike the previous administration.

That's why interest rates need to fall.

We analyze the current cycle from the perspective of global liquidity to emphasize why the current round of "devaluation trading" has reached its final stage.

Is fiscal dominance coming to an end?

We always hope to "buy the dip" when everyone else is "chasing the rise".

That's why all the recent discussions about "devaluation trading" have caught our attention.

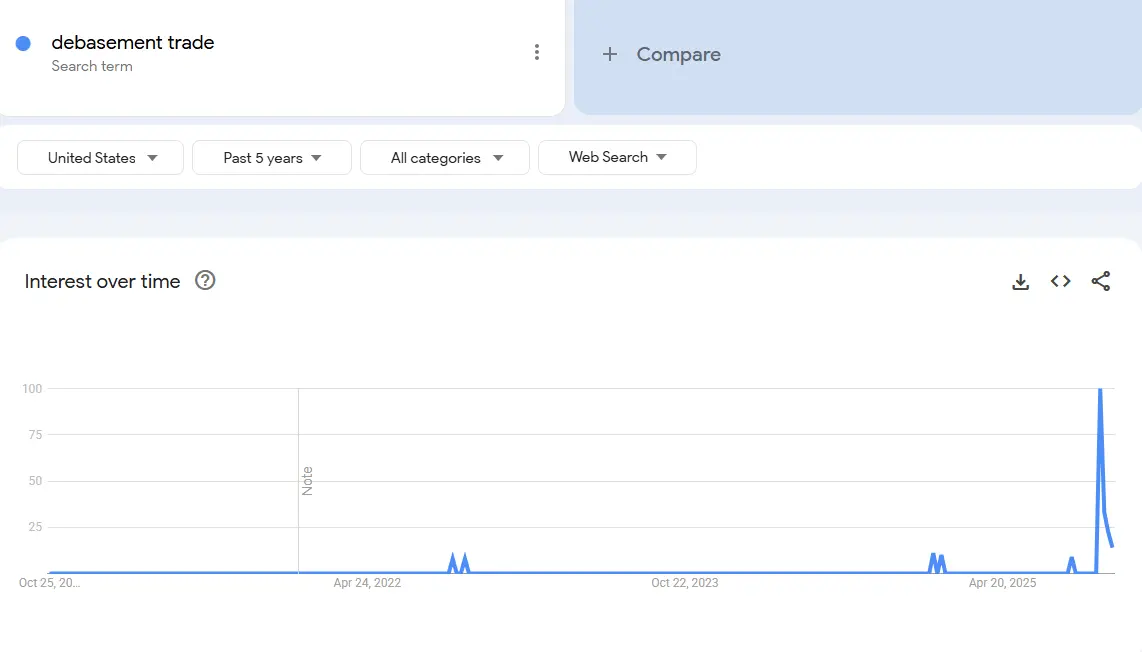
Data: Google Trends

We believe the interest in "devaluation trading" arose a few years ago. At that time, Bitcoin was priced at $25,000 and gold at $2,000. Back then, nobody talked about it except cryptocurrency and macro analysts.

In our view, this "deal" is essentially complete.

Therefore, our task is to understand the conditions that created it, and whether those conditions will continue to exist.

What drove this deal? In our view, there are mainly two factors.

1. Treasury spending. During the Biden administration, we implemented a large-scale fiscal deficit.
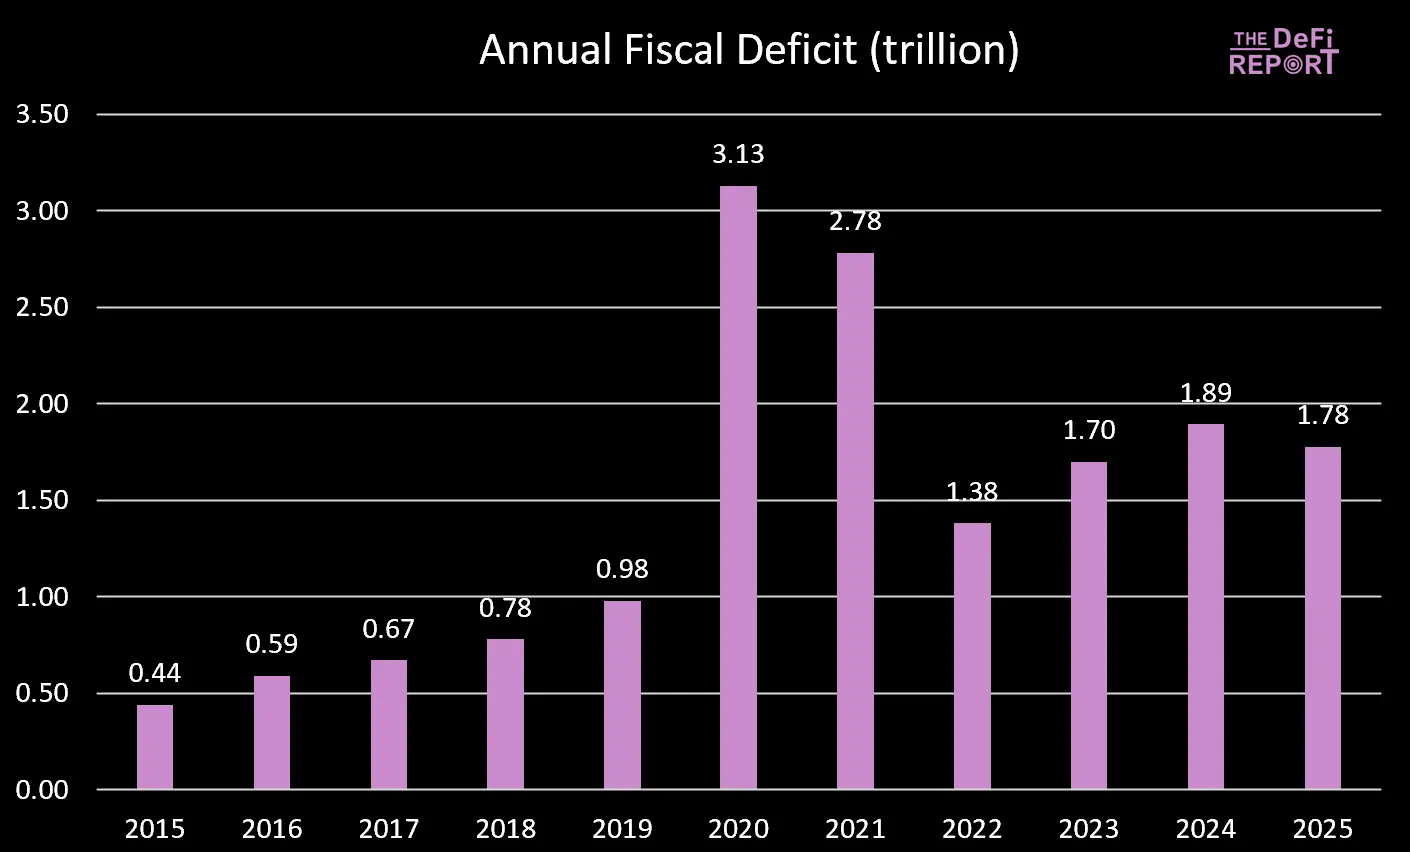
Data: US Treasury

The fiscal year 2025 has just ended, and the deficit has narrowed slightly—primarily due to increased taxes (tariffs) rather than reduced spending. However, the Big Beautiful Bill is expected to achieve spending cuts by reducing benefits from Medicaid and the Supplemental Nutrition Assistance Program (SNAP).
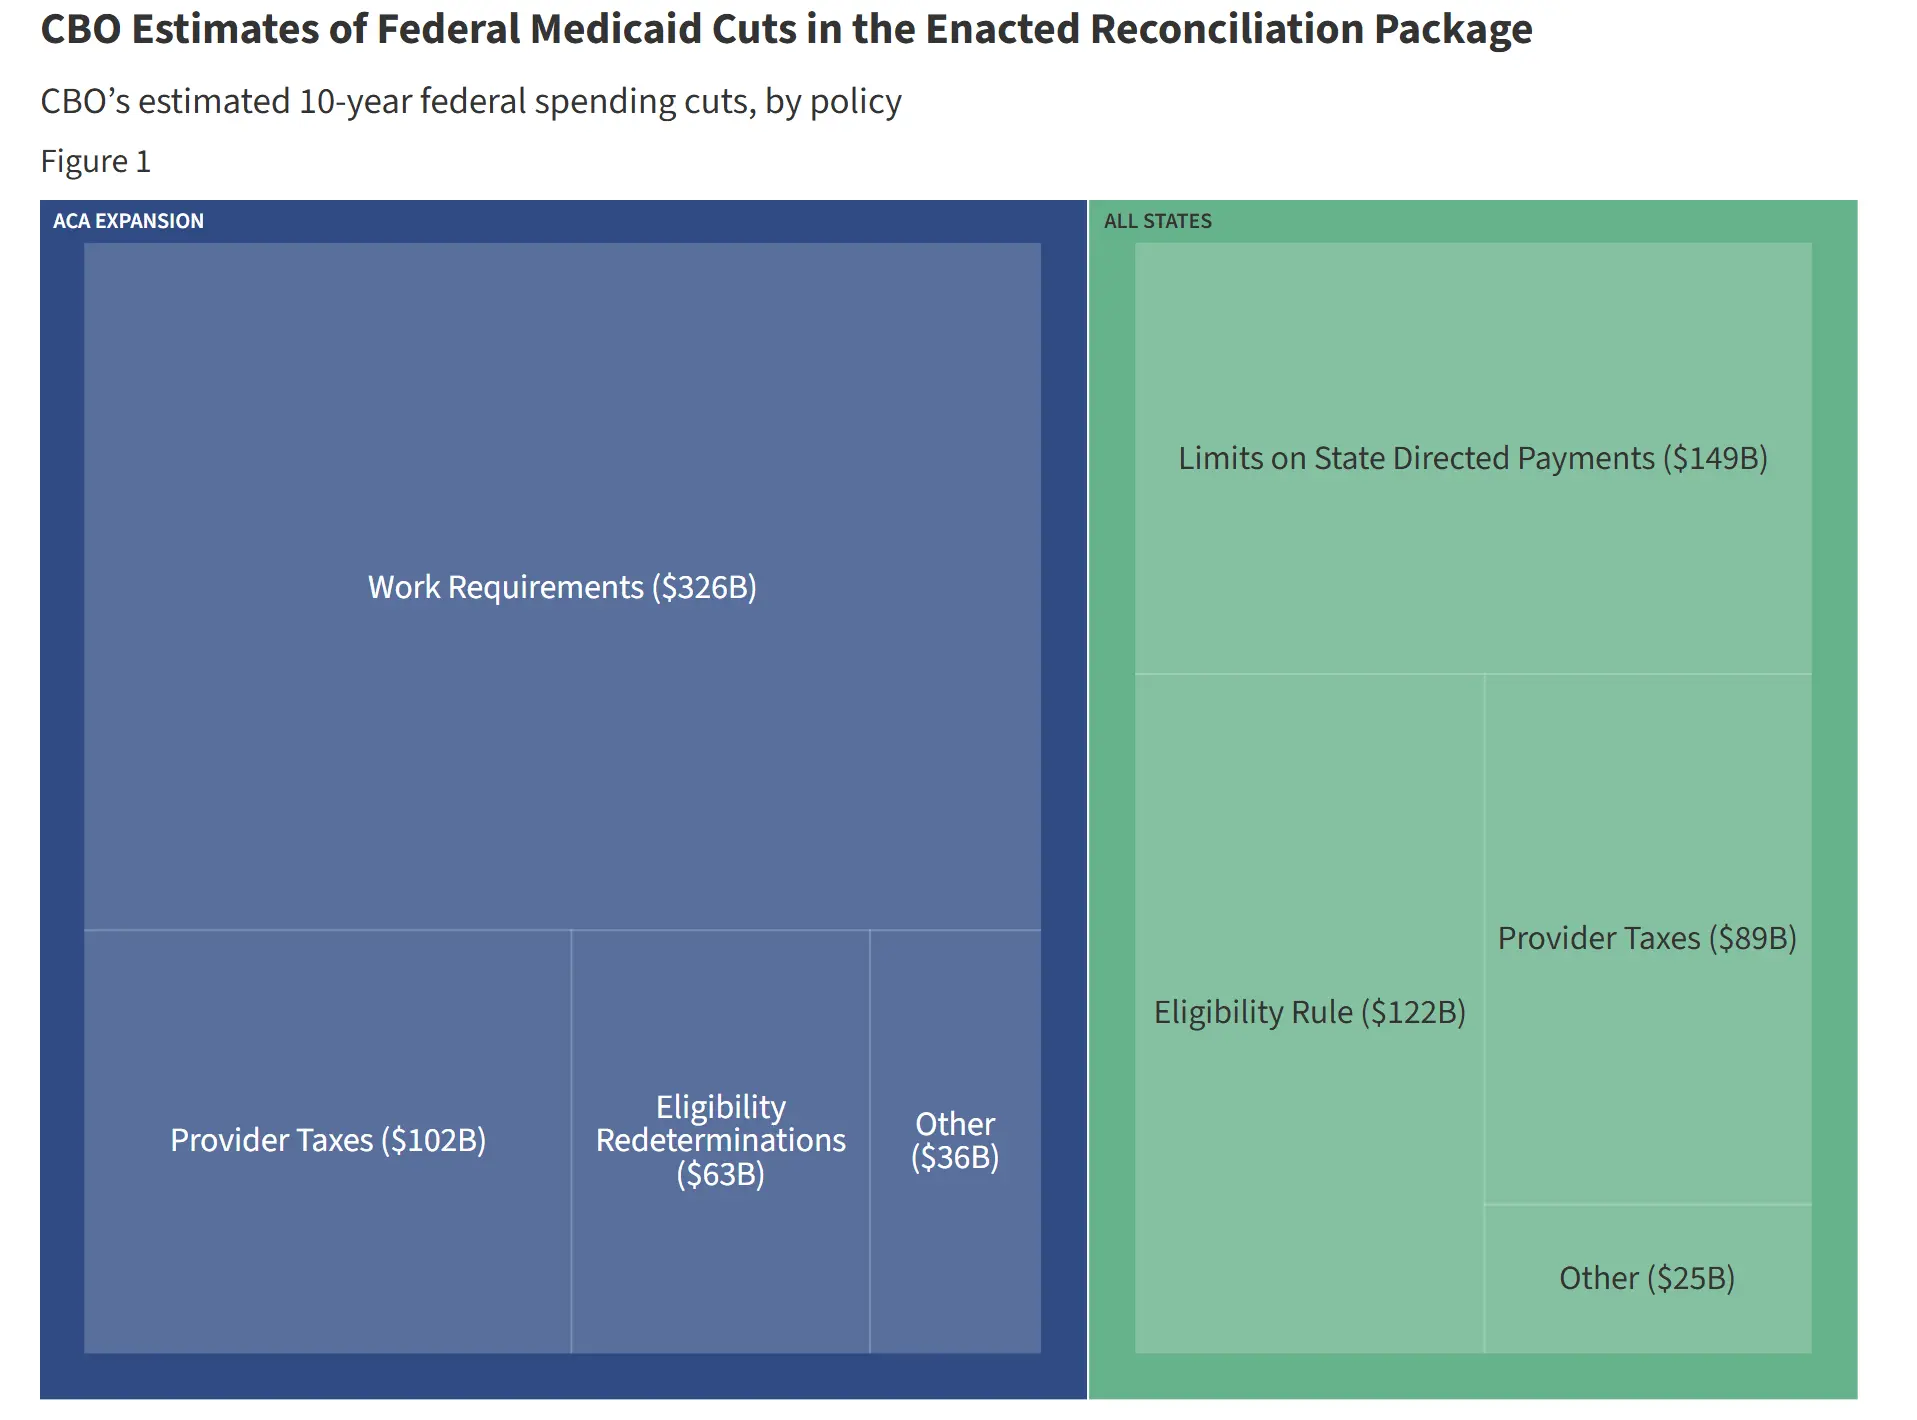
Data: Comparison of KFF (Kaiser Family Foundation) cuts with current spending trajectory

During Biden's presidency, government spending and transfer payments continuously injected liquidity into the economy. However, under the Great America Act, spending growth slowed.

This means that the government is injecting less money into the economy.

In addition, the government is withdrawing funds from the economy through tariffs.
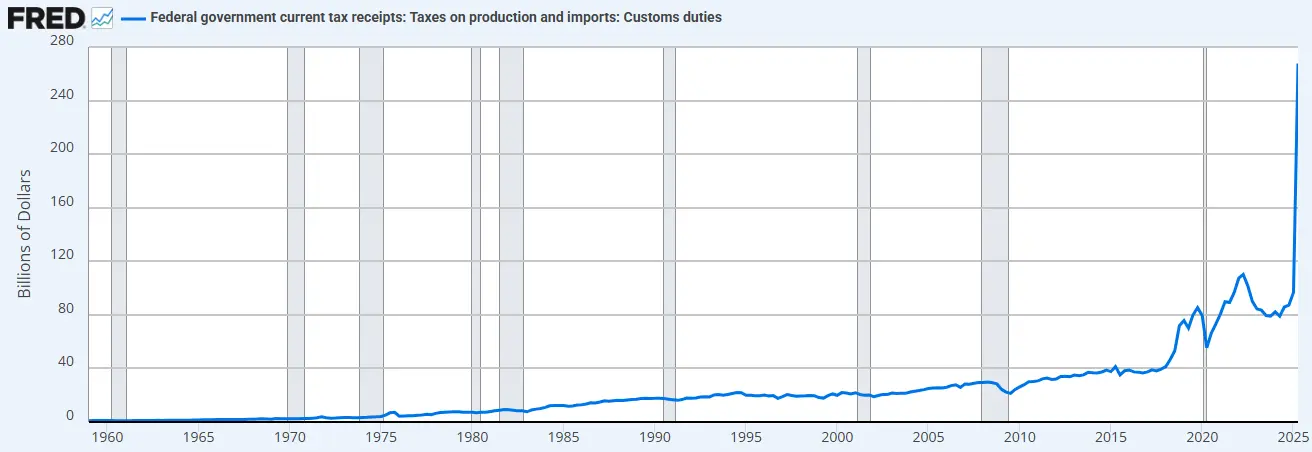
Data: FRED (St. Louis Federal Reserve Economic Data)

The combination of spending restrictions (relative to the previous administration) and increased tariffs means that the Treasury is now absorbing liquidity rather than supplying it.

This is why we need to cut interest rates.

"We will privatize the economy, revitalize the private sector, and shrink the government." - Scott Bessent

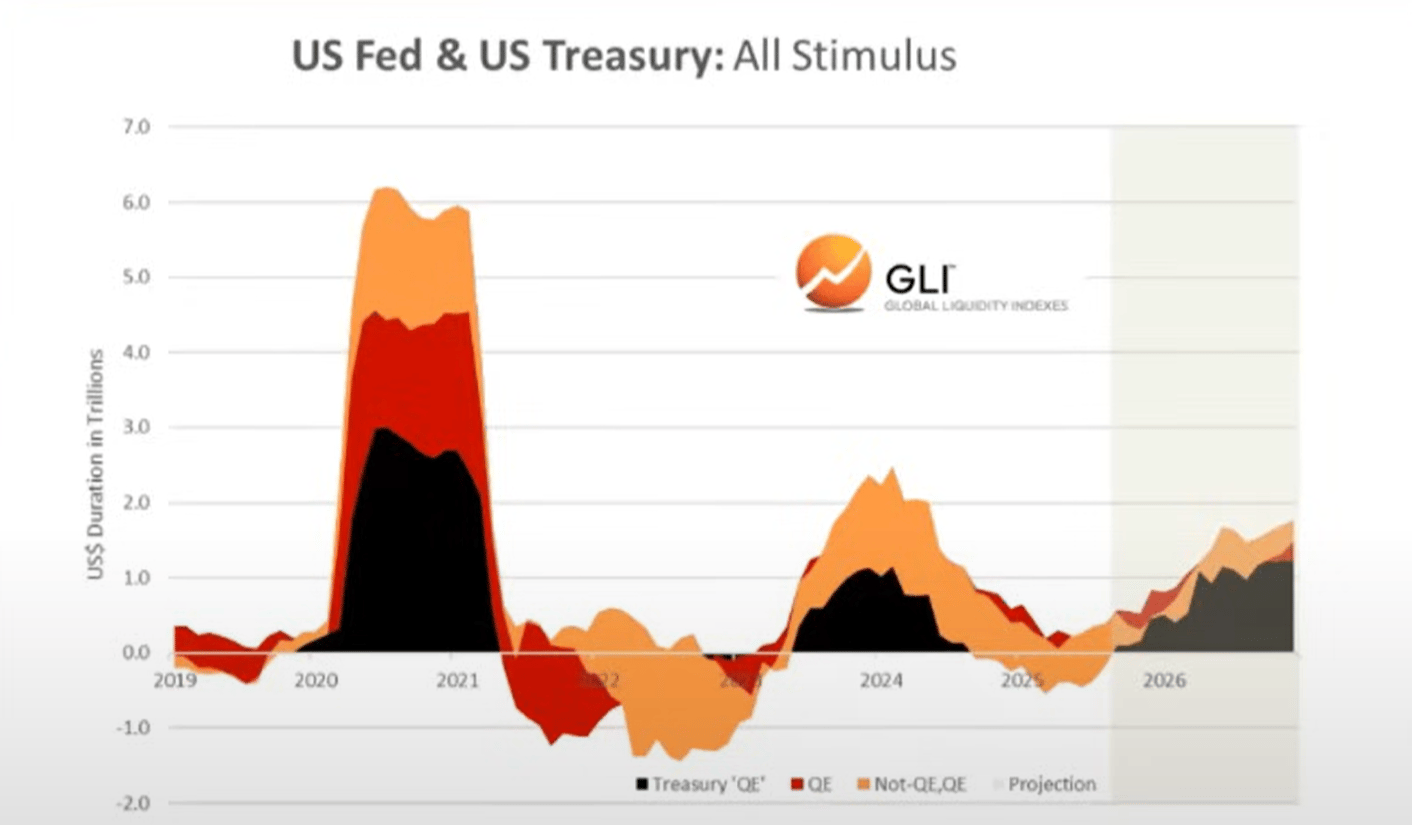
2. "Treasury QE". To fund the excessive spending by the Treasury during the Biden administration, we also saw a new form of "quantitative easing" (QE). We can observe this below (black line). "Treasury QE" supported the market by funding government spending through short-term notes rather than long-term bonds.
Data: Global Liquidity Index

We believe that fiscal spending and quantitative easing by the Treasury have fueled the “devaluation trade” and “everything bubble” that we have seen in the past few years.

But now we are transitioning to a "Trump economy," with the private sector taking over the reins from the Treasury.

Similarly, this is why they need to lower interest rates. They need to use bank loans to stimulate the private sector.

As we enter this transition period, the global liquidity cycle appears to be peaking...

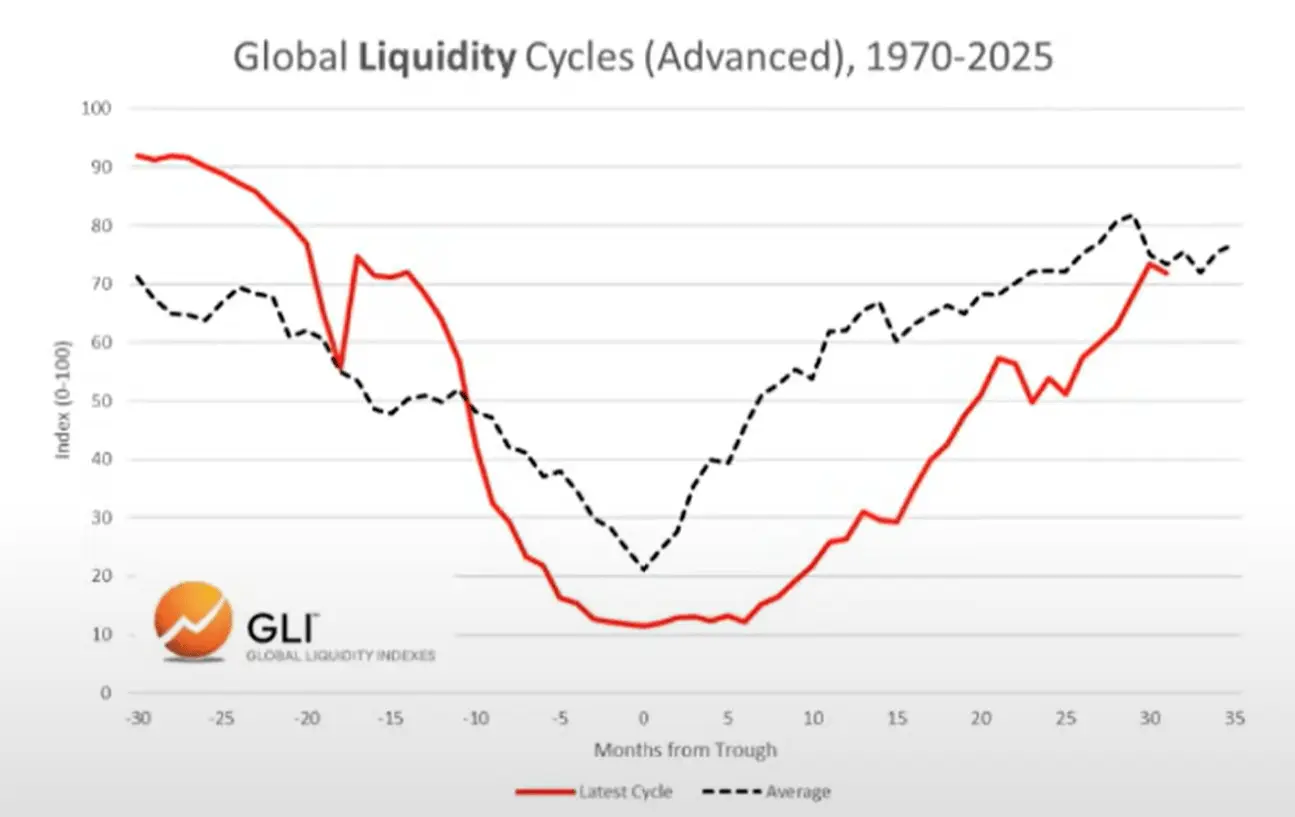
The global liquidity cycle is peaking and declining.

Current cycle and average cycle

Below, we can observe a comparison between the current cycle (red line) and the historical average cycle (gray line) since 1970.
Data: Global Liquidity Index

Asset allocation

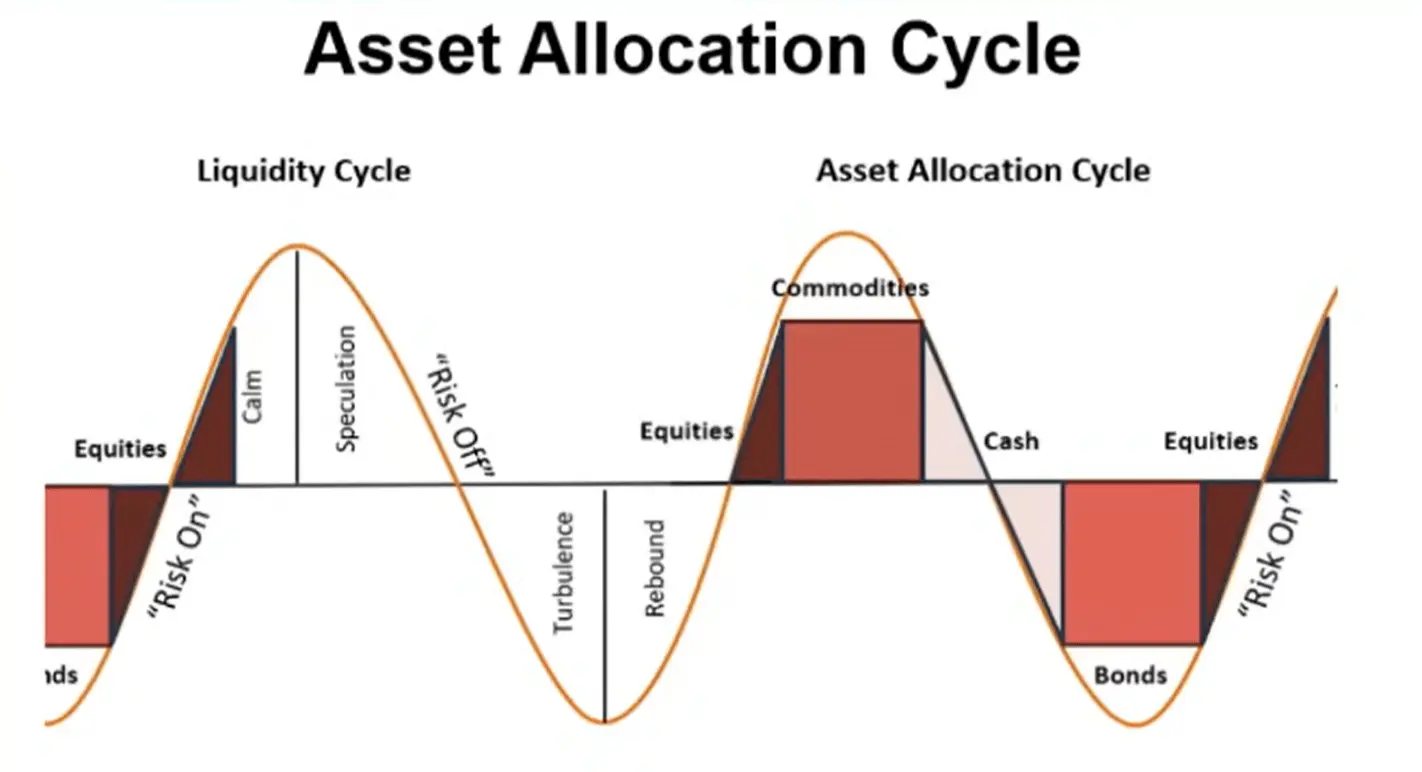
Based on Mr. Howell's work on global liquidity indices, we can observe typical liquidity cycles and their alignment with asset allocation.

Commodities are often the last assets to fall, which is exactly what we are seeing today (gold, silver, copper, palladium).

From this perspective, the current cycle looks very typical.
Data: Global Liquidity Index

So, if liquidity is indeed peaking, we expect investors to rotate into cash and bonds as the environment changes. To be clear, this process hasn't even begun yet (the market remains "risk-averse").

Debt and Liquidity

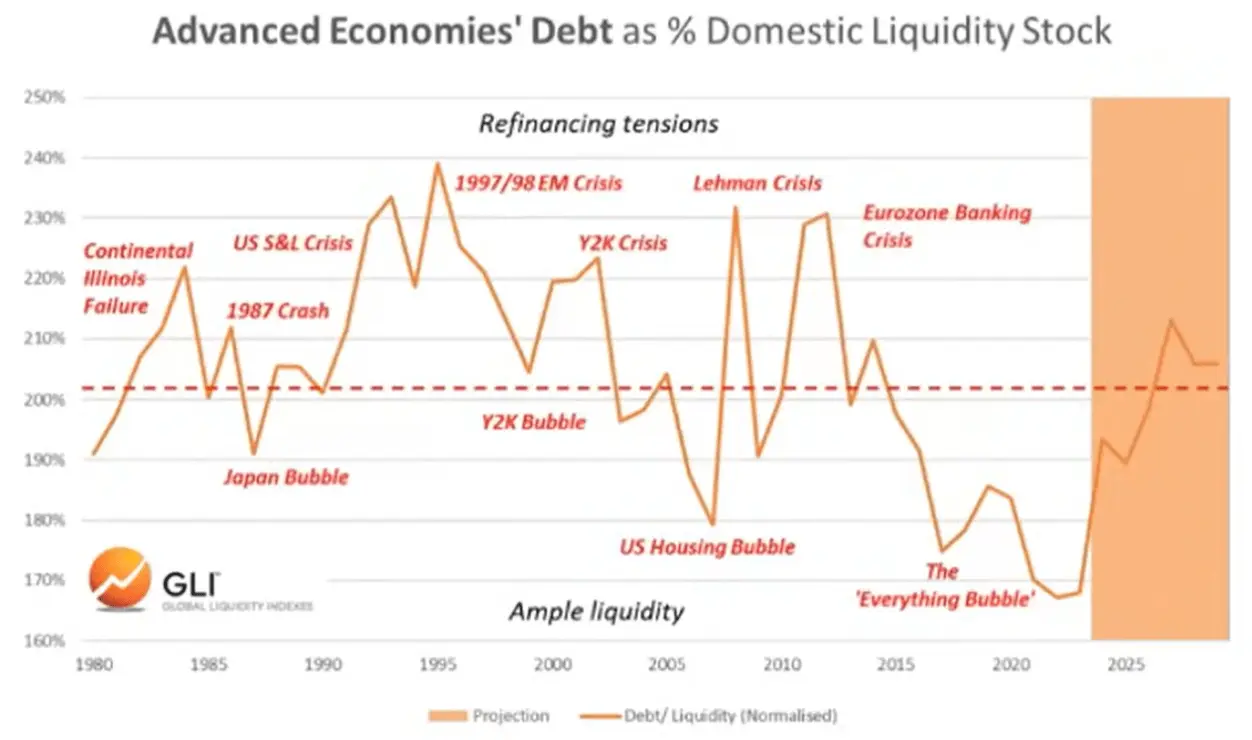
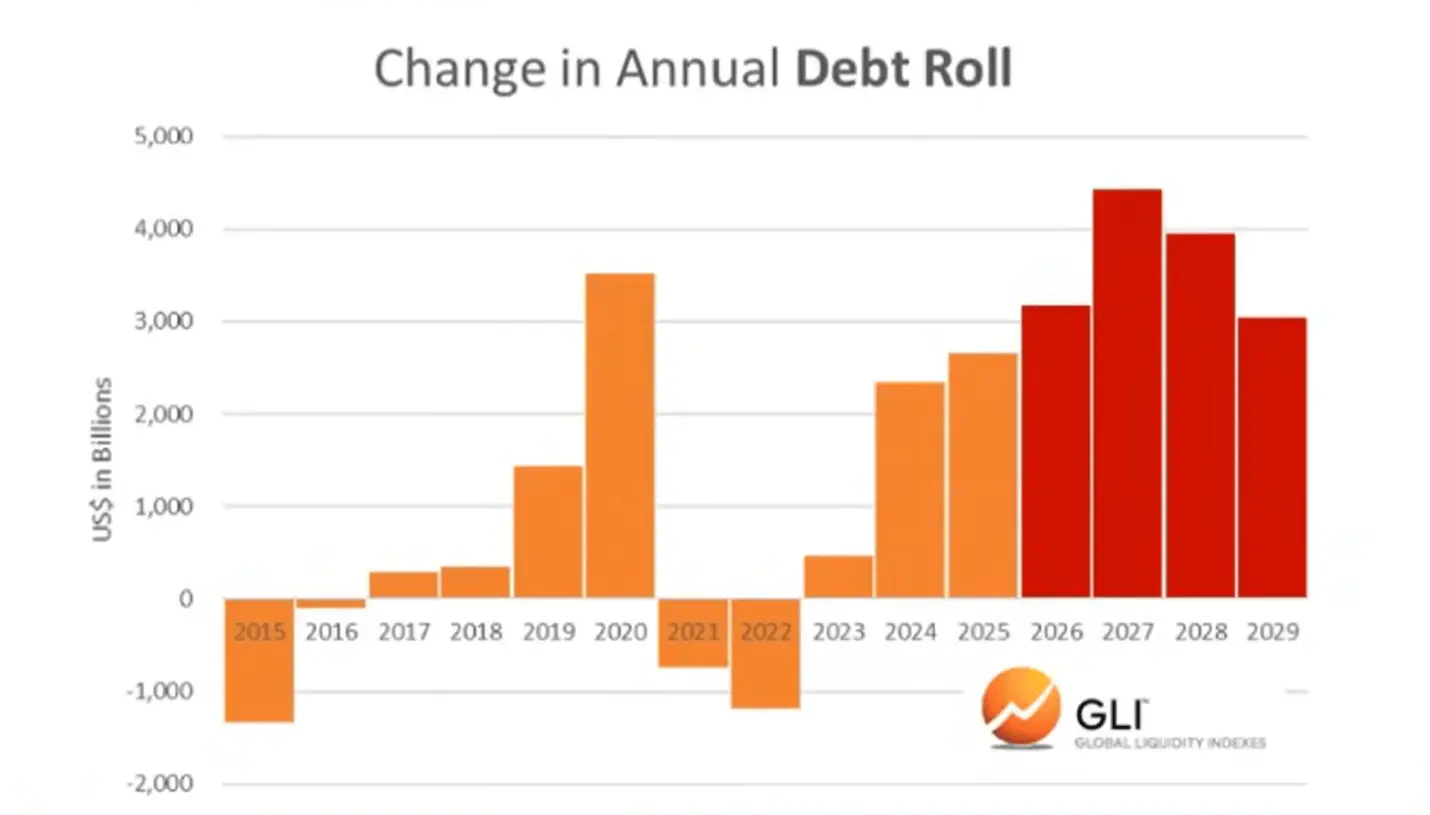
According to the Global Liquidity Index, the debt-to-liquidity ratio of major economies reached its lowest level since 1980 at the end of last year. It is now rising and is expected to continue rising until 2026.
Data: Global Liquidity Index

The rising debt-to-liquidity ratio makes it more difficult to service trillions of dollars of outstanding debt that need to be refinanced.
Data: Global Liquidity Index

Bitcoin and Global Liquidity

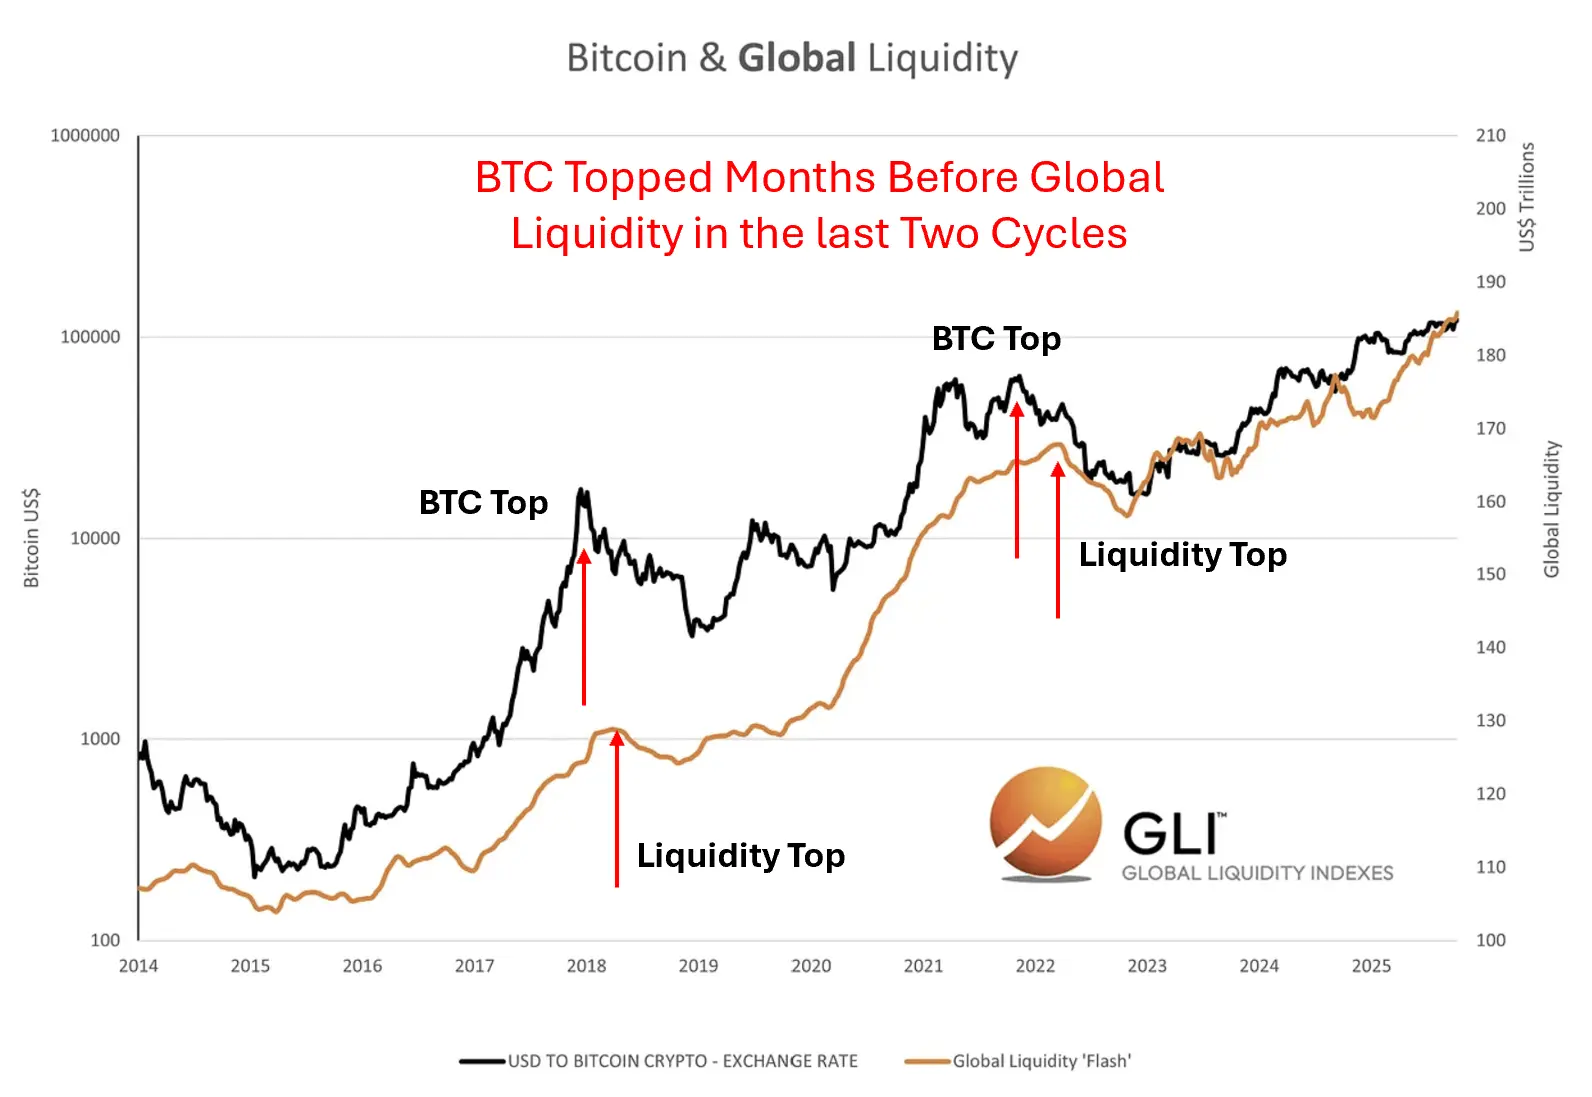
Of course, Bitcoin has "foreshadowed" peak global liquidity in the past two cycles. In other words, Bitcoin peaked months before liquidity peaked and began to decline, seemingly anticipating the subsequent drop.
Data: Global Liquidity Index

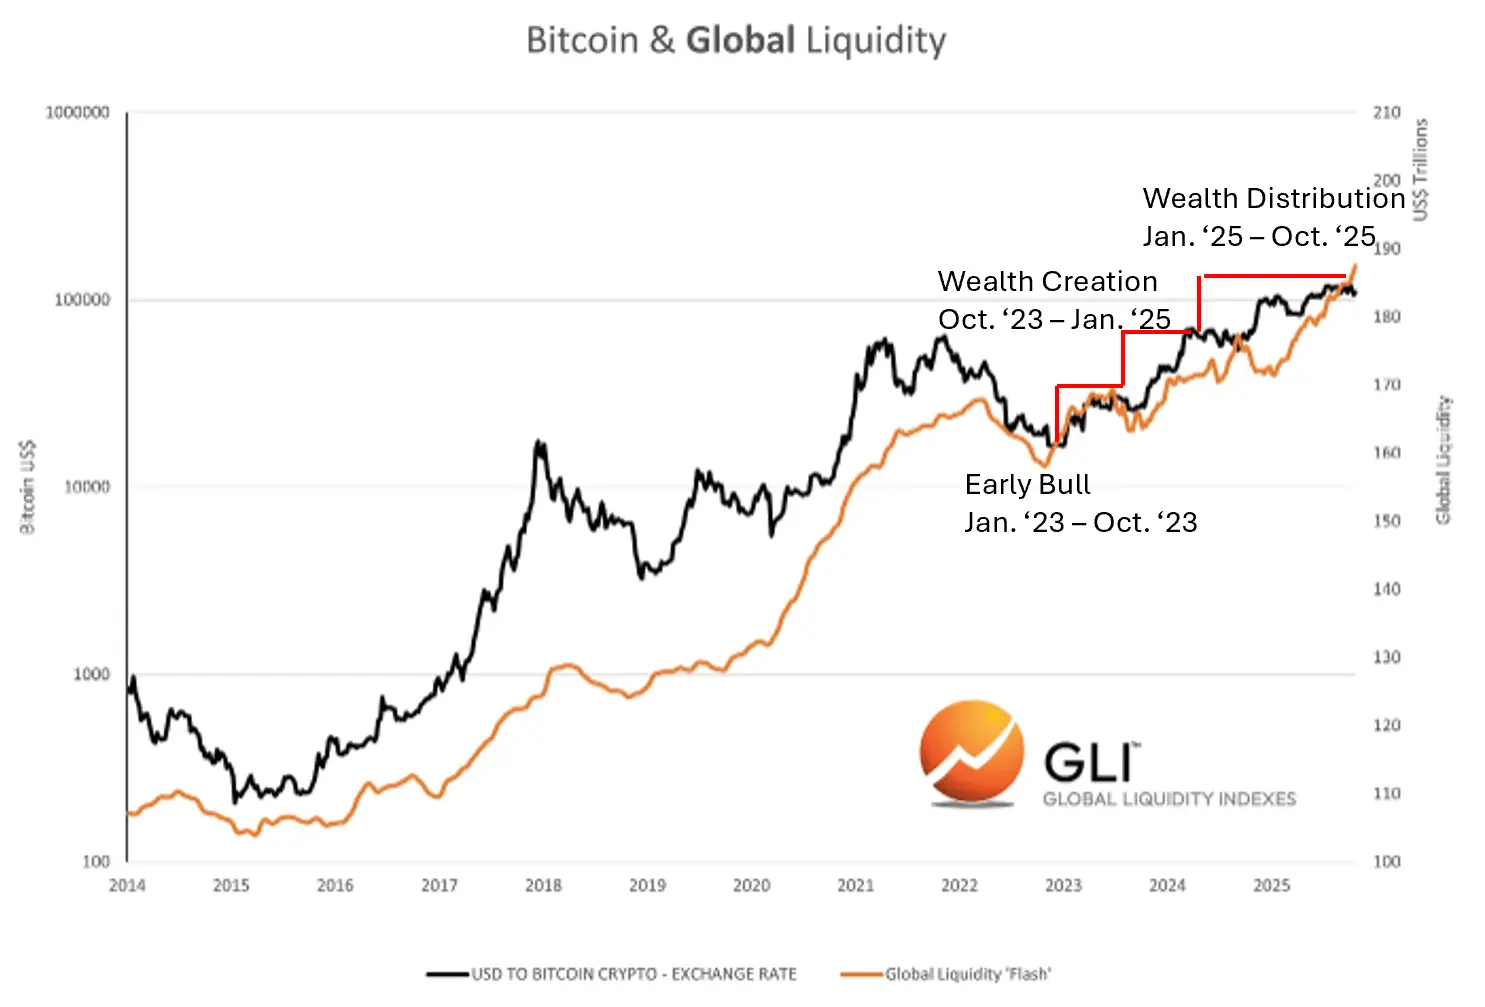
We don't know if this is happening right now. But we do know that cryptocurrency cycles always closely follow liquidity cycles.

Alignment with the cryptocurrency cycle
Data: Global Liquidity Index

Disclaimer: The articles reposted on this site are sourced from public platforms and are provided for informational purposes only. They do not necessarily reflect the views of MEXC. All rights remain with the original authors. If you believe any content infringes on third-party rights, please contact service@support.mexc.com for removal. MEXC makes no guarantees regarding the accuracy, completeness, or timeliness of the content and is not responsible for any actions taken based on the information provided. The content does not constitute financial, legal, or other professional advice, nor should it be considered a recommendation or endorsement by MEXC.
Share Insights

You May Also Like

While the global market is rising, cryptocurrencies are falling. What exactly is the problem?

While the global market is rising, cryptocurrencies are falling. What exactly is the problem?

Author: Jasper De Maere , OTC Strategist at Wintertermute Compiled by: Tim, PANews The macroeconomic environment remains supportive, with positive events such as interest rate cuts, the end of quantitative tightening, and stock indices nearing high levels occurring one after another. However, the crypto market continues to lag behind as post-Federal Reserve policy meeting liquidity is waning. Global liquidity continues to expand, but funds are not flowing into the crypto market. ETF inflows have stagnated, decentralized AI activity has dried up, and only stablecoins are maintaining growth. Leverage has been cleared, and the market structure appears healthy, but a rebound in ETF or DAT funds would be the key signal for a liquidity recovery and the start of a potential catch-up rally. Macroeconomic Status Quo Last week, the market experienced volatility due to the Federal Reserve's rate cut, the FOMC meeting minutes, and earnings reports from several US technology companies. We saw the expected 25 basis point rate cut, officially concluding quantitative tightening, and the earnings of the "Big Seven" US stocks were generally positive. However, market volatility occurred after Powell downplayed the near certainty of another rate cut in December. The probability of a rate cut, which had been priced in by the market before the meeting (95%), has now fallen to 68%, prompting traders to reassess their strategies and triggering a rapid shift towards risk aversion. This sell-off didn't seem driven by panic, but rather resembled position adjustments. Some investors had over-bet on a rise before the event, creating a classic "sell the news" situation, as the market had already fully priced in the 25 basis point rate cut. The stock market subsequently stabilized quickly, but the cryptocurrency market did not see a synchronized rebound. Since then, BTC and ETH have been trading sideways, hovering around $107,000 and $3,700 respectively as of this writing. Altcoins have also exhibited a volatile pattern, with their excess gains primarily driven by short-term narratives. Compared to other asset classes, cryptocurrencies are the worst-performing asset class. From an index perspective, crypto assets in a broad sense experienced a significant sell-off last week, with the GMCI-30 index falling 12%. Most sectors closed lower. The gaming sector plummeted 21%. Layer 2 network sector plunges 19% The meme coin sector declined by 18%. Mid-cap and small-cap tokens fell by approximately 15%-16%. Only the AI (-3%) and DePIN (-4%) sectors showed relative resilience, mainly due to the strong performance of TAO tokens and AI proxy concept coins in the early part of last week. Overall, this volatility seems more like a money-driven phenomenon, consistent with the tightening liquidity following the Fed's decision, rather than caused by fundamental factors. So why are cryptocurrencies lagging behind while global risk assets are rising? In short: liquidity. But it's not a lack of liquidity, but rather a problem of where it flows. Global liquidity is clearly expanding. Central banks are intervening in relatively strong rather than weak markets, a situation that has only occurred a few times in the past, usually followed by a strong surge in risk appetite. The problem is that this new liquidity is not flowing into the crypto market as it has in the past. Stablecoin supply continues to climb steadily (up 50% year-to-date, adding $100 billion), but Bitcoin ETF inflows have stagnated since the summer, with assets under management hovering around $150 billion. The once-booming crypto treasury DAT has fallen silent, and related concept stocks listed on exchanges like Nasdaq have seen a significant drop in trading volume. Of the three major funding engines driving the market in the first half of this year, only stablecoins are still playing a role. ETF funding has peaked, DAT activity has dried up, and although overall liquidity remains ample, the share flowing into the crypto market has shrunk significantly. In other words, the tap for funds hasn't been turned off; it's just that the funds have flowed elsewhere. The novelty of ETFs has worn off, allocation ratios have become more normalized, and retail investors' funds have flowed elsewhere, turning to chase the trends in stocks, artificial intelligence, and prediction markets. Our Viewpoint The stock market performance proves that the market environment remains strong; liquidity has simply not yet been transmitted to the crypto market. Although the market is still digesting the 10/11 liquidation, the overall structure remains robust—leverage has been cleared, volatility is under control, and the macroeconomic environment is supportive. Bitcoin continues to act as a market anchor thanks to stable ETF inflows and tight exchange supply, while Ethereum and some L1 and L2 tokens have begun to show signs of relative strength. While a growing number of voices on crypto social media are attributing the price weakness to the four-year cycle theory, this concept is no longer truly applicable. In mature markets, the miner supply and halving mechanisms that once drove cycles have long since failed; the core factor truly determining price performance is now liquidity. The macroeconomic environment continues to provide strong support—the interest rate cut cycle has begun, quantitative tightening has ended, and the stock market is frequently hitting new highs—but the crypto market has lagged behind, primarily due to the lack of effective liquidity inflows. Compared to the three major drivers of capital inflows last year and in the first half of this year (ETFs, stablecoins, and DeFi yield assets), only stablecoins are currently showing a healthy trend. Close monitoring of ETF inflows and DAT activity will be key indicators, as these are likely to be the earliest signals of liquidity returning to the crypto market.
Share
PANews2025/11/05 16:50