XRP Price Steadies Above Support, Break Higher Or Fade Again?
XRP price failed to surpass $1.50 and started another decline. The price is now correcting gains and might find strong bids near $1.340.
- XRP price started a downside correction and declined below $1.420.
- The price is now trading below $1.40 and the 100-hourly Simple Moving Average.
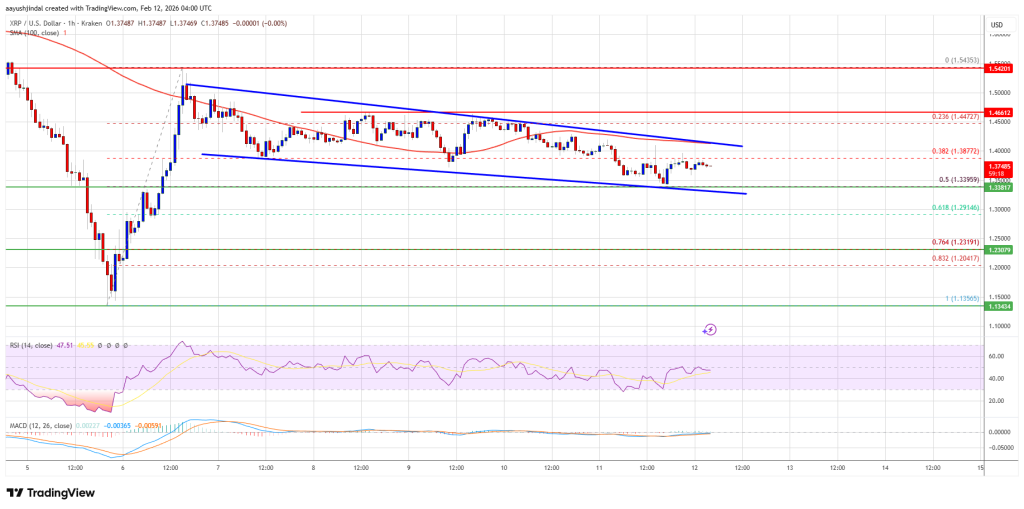
- There is a declining channel forming with resistance at $1.4050 on the hourly chart of the XRP/USD pair (data source from Kraken).
- The pair could start another increase if it stays above $1.3320.
XRP Price Holds Support
XRP price failed to stay above $1.50 and started a downside correction, like Bitcoin and Ethereum. The price dipped below the $1.450 and $1.420 levels to enter a negative zone.
The price even dipped below the 38.2% Fib retracement level of the upward move from the $1.1356 swing low to the $1.5435 high. However, the bulls remained active near the $1.340 zone. Besides, there is a declining channel forming with resistance at $1.4050 on the hourly chart of the XRP/USD pair.
The price is now trading below $1.40 and the 100-hourly Simple Moving Average. If there is a fresh upward move, the price might face resistance near the $1.40 level. The first major resistance is near the $1.4050 level, above which the price could rise and test $1.4650.
A clear move above the $1.4650 resistance might send the price toward the $1.50 resistance. Any more gains might send the price toward the $1.5250 resistance. The next major hurdle for the bulls might be near $1.550.
More Losses?
If XRP fails to clear the $1.4050 resistance zone, it could start a fresh decline. Initial support on the downside is near the $1.3380 level or the 50% Fib retracement level of the upward move from the $1.1356 swing low to the $1.5435 high. The next major support is near the $1.2920 level.
If there is a downside break and a close below the $1.2920 level, the price might continue to decline toward $1.250. The next major support sits near the $1.2320 zone, below which the price could continue lower toward $1.2150.
Technical Indicators
Hourly MACD – The MACD for XRP/USD is now gaining pace in the bearish zone.
Hourly RSI (Relative Strength Index) – The RSI for XRP/USD is now below the 50 level.
Major Support Levels – $1.3380 and $1.2920.
Major Resistance Levels – $1.4050 and $1.450.
Ayrıca Şunları da Beğenebilirsiniz

Pi Network Enables Real Shopping with Picoin, Driving Demand and Utility

Remittix Investors To Receive A 300% Bonus Ending Today After Major Project Success